We maintain several market timing models, each with differing time horizons. The "Ultimate Market Timing Model" is a long-term market timing model based on research outlined in our post Building the ultimate market timing model. This model tends to generate only a handful of signals each decade.
The Trend Model is an asset allocation model which applies trend following principles based on the inputs of global stock and commodity price. This model has a shorter time horizon and tends to turn over about 4-6 times a year. In essence, it seeks to answer the question, "Is the trend in the global economy expansion (bullish) or contraction (bearish)?"
My inner trader uses the trading component of the Trend Model seeks to answer the question, "Is the trend getting better (bullish) or worse (bearish)?" The history of actual out-of-sample (not backtested) signals of the trading model are shown by the arrows in the chart below. Past trading of this model has shown turnover rates of about 200% per month.

The signals of each model are as follows:
- Ultimate market timing model: Buy equities*
- Trend Model signal: Risk-on (upgrade)*
- Trading model: Bullish*
Update schedule: I generally update model readings on my site on weekends and tweet any changes during the week at @humblestudent. Subscribers will also receive email notices of any changes in my trading portfolio.
How the USD tells us about the stock market
I have been asked in the past to describe my brand of market analysis, which can be characterized in a number of ways. Technicians would call my approach inter-market analysis. Fundamentally driven investors may regard me as a global macro or cross-asset analyst. That`s because all markets are inter-connected and to simply focus at any single stock, sector or market in isolation misses the big picture.
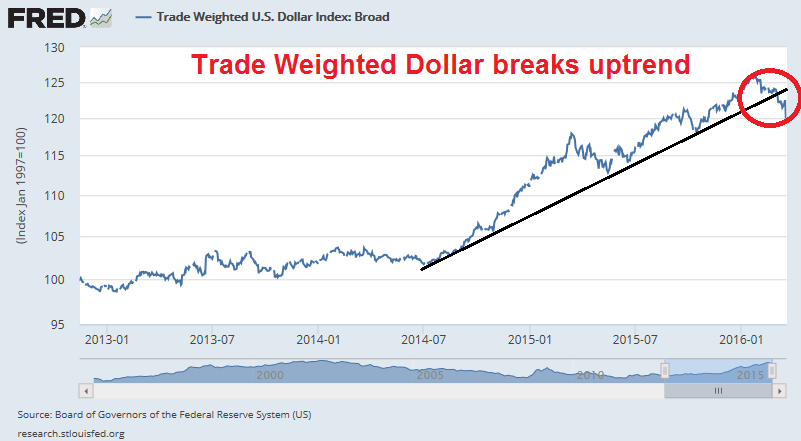
To illustrate my point, I would like to show why I believe that the US Dollar holds the key to the medium term outlook (6-12 months) for US equities. As the chart below shows, the Trade Weighted Dollar has seen a clear breach of an uptrend line, which has bullish implications for equity bulls.
The full post is at our new site here.
