We maintain several market timing models, each with differing time horizons. The "Ultimate Market Timing Model" is a long-term market timing model based on the research outlined in our post, Building the ultimate market timing model. This model tends to generate only a handful of signals each decade.
The Trend Model is an asset allocation model which applies trend following principles based on the inputs of global stock and commodity price. This model has a shorter time horizon and tends to turn over about 4-6 times a year. In essence, it seeks to answer the question, "Is the trend in the global economy expansion (bullish) or contraction (bearish)?"

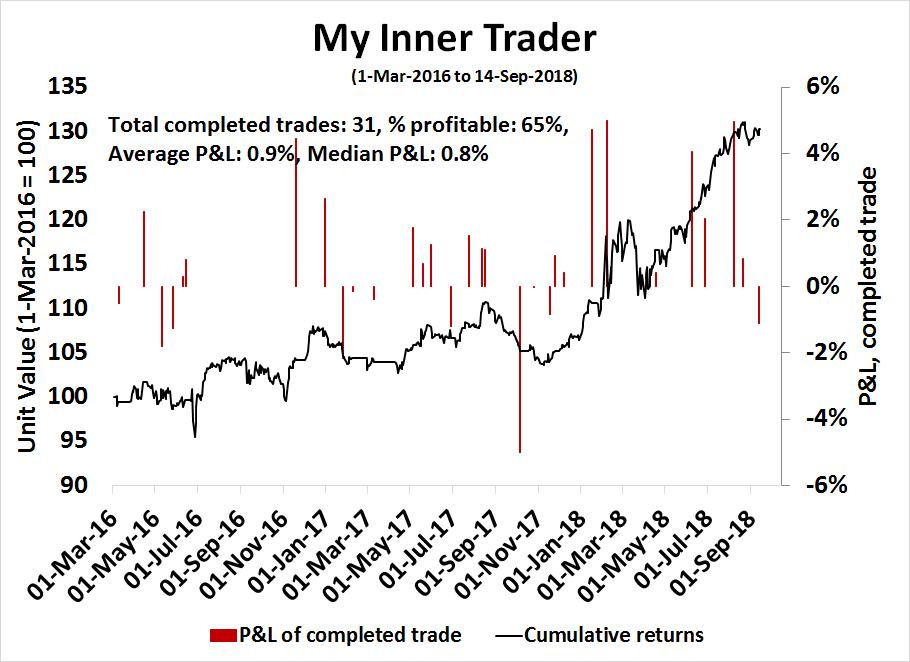
My inner trader uses the trading component of the Trend Model to look for changes in the direction of the main Trend Model signal. A bullish Trend Model signal that gets less bullish is a trading "sell" signal. Conversely, a bearish Trend Model signal that gets less bearish is a trading "buy" signal. The history of actual out-of-sample (not backtested) signals of the trading model are shown by the arrows in the chart below. The turnover rate of the trading model is high, and it has varied between 150% to 200% per month.
Subscribers receive real-time alerts of model changes, and a hypothetical trading record of the those email alerts are updated weekly here. The hypothetical trading record of the trading model of the real-time alerts that began in March 2016 is shown below.
The latest signals of each model are as follows:
- Ultimate market timing model: Buy equities*
- Trend Model signal: Neutral*
- Trading model: Bearish*
Update schedule: I generally update model readings on my site on weekends and tweet mid-week observations at @humblestudent. Subscribers receive real-time alerts of trading model changes, and a hypothetical trading record of the those email alerts is shown here.
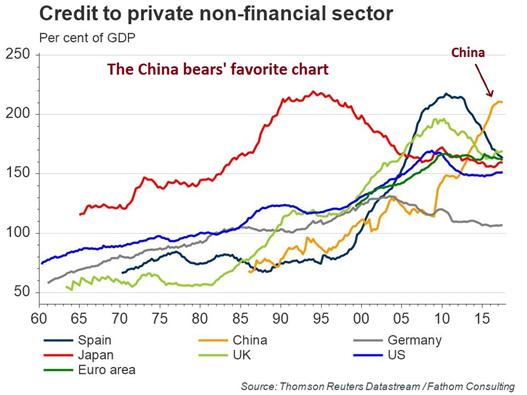
How much runway is left in China's long landing?
The bears have been warning about China's unsustainable debt for years. So far, it has been a "this will not end well" investment story, with no obvious bearish trigger and no time frame for a crisis.
Michael Pettis is one of the few China watchers who have established a time frame for China to resolve its problems. He outlined a scenario four years ago where China would not crash, but experience a "long landing" where growth gradually decelerates. Pettis elaborated on his best case scenario in an email to me (see Michael Pettis on the risks of the long landing scenario):
My "best-case" rebalancing scenario, as I think you know, consists of an upper limit to average GDP growth of 3-4% over the presumed decade of President Xi's administration (2013-23), driven by growth in household income of 5-7% and commensurate growth in household consumption. Although when it comes to China I have been the big, bad bear for so long that perhaps I tend to want to understate my pessimism, I nonetheless always try to remind my clients, sometimes not very loudly if I am in a public forum, that this is not my expected "most likely outcome". He went on to elaborate that his best guess is the current pace of credit growth was only sustainable until 2017-2018:
My guess (and it is only a guess), is that China can continue the current pace of credit growth for another 3-4 years at most, after which it cannot grow credit fast enough both to roll over what Hyman Minsky suggested was likely to be exponential growth in unrecognized bad debt (and WMP and other shadow banking assets will almost certainly be absorbed into the formal banks), and to provide enough new lending to fund further economic activity. If there is less time, as I think Anne Stevenson might argue, or if Beijing cannot get credit and rebalancing under control before then, I think we can probably assume my "orderly long landing" scenario is less likely.Here we are, four years later. How is China managing its long landing?
The full post can be found at our new site here.
