We maintain several market timing models, each with differing time horizons. The "Ultimate Market Timing Model" is a long-term market timing model based on the research outlined in our post, Building the ultimate market timing model. This model tends to generate only a handful of signals each decade.
The Trend Asset Allocation Model is an asset allocation model which applies trend following principles based on the inputs of global stock and commodity price. This model has a shorter time horizon and tends to turn over about 4-6 times a year. In essence, it seeks to answer the question, "Is the trend in the global economy expansion (bullish) or contraction (bearish)?"
My inner trader uses a trading model, which is a blend of price momentum (is the Trend Model becoming more bullish, or bearish?) and overbought/oversold extremes (don't buy if the trend is overbought, and vice versa). Subscribers receive real-time alerts of model changes, and a hypothetical trading record of the email alerts are updated weekly here. The hypothetical trading record of the trading model of the real-time alerts that began in March 2016 is shown below.

The latest signals of each model are as follows:
- Ultimate market timing model: Buy equities*
- Trend Model signal: Bullish*
- Trading model: Neutral*
Update schedule: I generally update model readings on my site on weekends and tweet mid-week observations at @humblestudent. Subscribers receive real-time alerts of trading model changes, and a hypothetical trading record of those email alerts is shown here.
Subscribers can access the latest signal in real-time here.
An overbought market
The S&P 500 closed November above its upper monthly Bollinger Band. This is a rare occurrence and going back to 1990, there were 14 occurrences. Exactly half of the episodes saw the market continue to rise, and the other half fell.

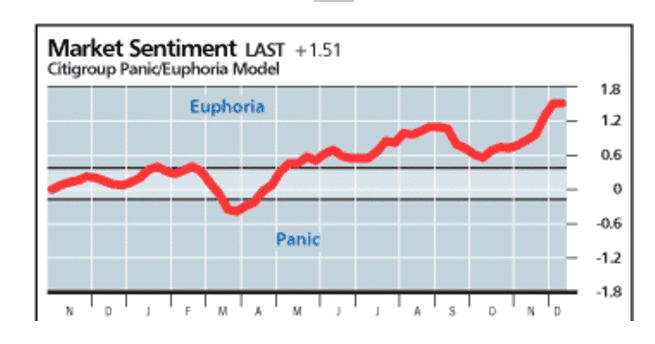
Virtually all sentiment models are screaming "caution"!
On the other hand, momentum is extremely strong after the S&P 500 gained 10.8% in November. Are these overbought conditions the signs of a melt-up, or the warnings of an imminent pullback?
The full post can be found here.
