Mid-week market update: I highlighted this chart as a possible warning on the weekend (see Melt-up, or meltdown?). In the past, high levels of correlation between the S&P 500 and VVIX, the volatility of the VIX, has generally led to market stalls. In addition, high correlations between the S&P 500 and the VIX Index has also been warnings of market tops. We have seen 14 similar warnings in the past three years. nine episodes were resolved in a bearish way (red vertical lines), and five saw the market either consolidate sideways or continue to rise (blue lines).
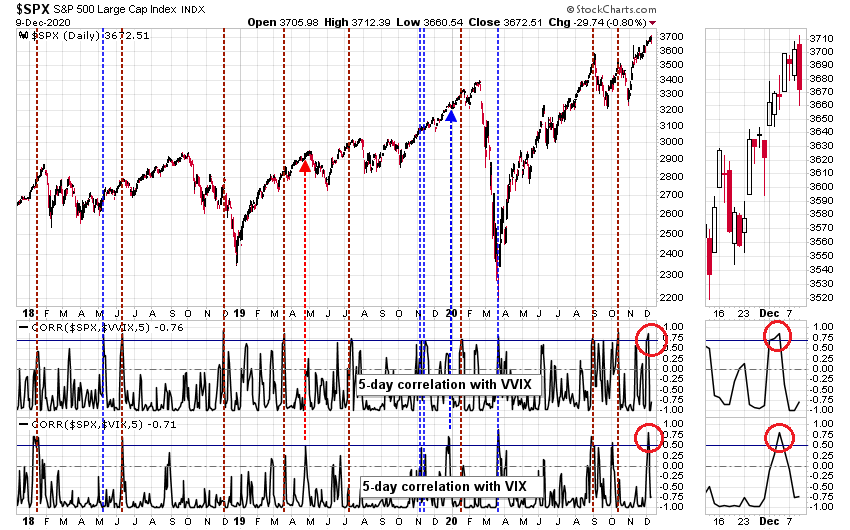
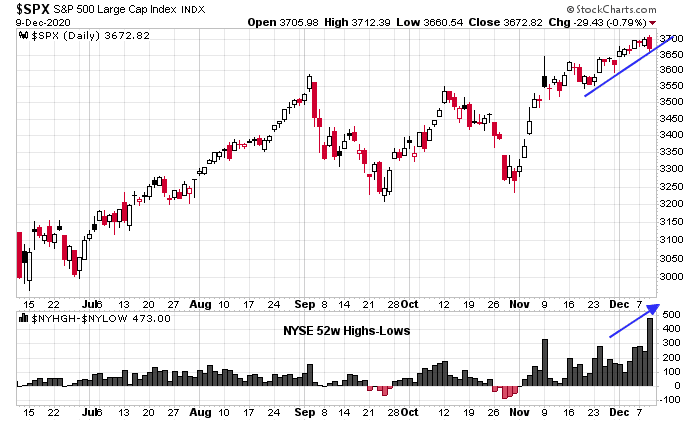
The bulls are on the verge of dodging a bullet. All of the bearish instances saw the market decline soon after the signal. It has been a week since correlations spiked on December 2, 2020. While the S&P 500 is testing rising trend line support as NYSE net highs surged, there is no sign of a downside break. Moreover, NYSE breadth, as measured by advances-declines, was surprisingly positive even as the S&P 500 fell -0.8% on the day.
Tactically, the bearish window is closing very quickly. Today's decline may be the bears' last chance.
The full post can be found here.
The bearish window is closing quickly
December 09, 2020 at 16:26 PM EST