The Trend Asset Allocation Model is an asset allocation model that applies trend-following principles based on the inputs of global stock and commodity prices. This model has a shorter time horizon and tends to turn over about 4-6 times a year. The performance and full details of a model portfolio based on the out-of-sample signals of the Trend Model can be found here.

My inner trader uses a trading model, which is a blend of price momentum (is the Trend Model becoming more bullish, or bearish?) and overbought/oversold extremes (don't buy if the trend is overbought, and vice versa). Subscribers receive real-time alerts of model changes, and a hypothetical trading record of the email alerts is updated weekly here. The hypothetical trading record of the trading model of the real-time alerts that began in March 2016 is shown below.

The latest signals of each model are as follows:
- Ultimate market timing model: Buy equities (Last changed from “sell” on 28-Jul-2023)*
- Trend Model signal: Bullish (Last changed from “neutral” on 28-Jul-2023)*
- Trading model: Bullish (Last changed from “neutral” on 20-Nov-2023)*
Update schedule: I generally update model readings on my site on weekends. I am also on X/Twitter at @humblestudent. Subscribers receive real-time alerts of trading model changes, and a hypothetical trading record of those email alerts is shown here.
Subscribers can access the latest signal in real time here.
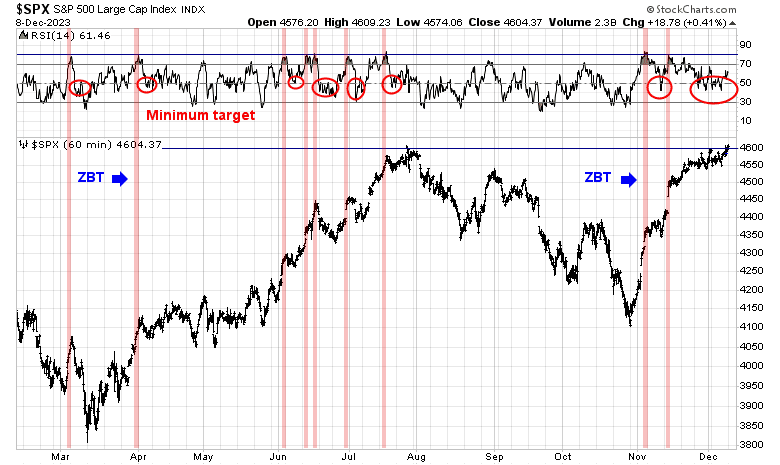
A healthy consolidationThe S&P 500 staged a late Friday breakout above 4600 out of a narrow consolidation range. The accompanying hourly chart shows that whenever the 14-hour RSI reaches an overbought extreme of 90 or more, it has retreated to a minimum level of 50, which it has in the latest episode. In light of the powerful momentum exhibited by the Zweig Breadth Thrust buy signal in early November, the market has met the conditions for another bull run in the near future.
I continue to believe that stocks are poised for a rally into year-end. My analysis of market internals shows that the market’s animal spirits are still alive. The full post can be found here.
