Taiwan Semiconductor Manufacturing Company Limited (TSM) is navigating a fiercely competitive chip industry. However, the company’s prospects remain uplifted amid the competition between the United States and China for tech supremacy.
TSM unveiled its N2 Prototype this year, which is expected to provide up to 10% higher performance and 30% lower power consumption than the company’s existing 5 nm process. This advanced semiconductor technology is set to enter volume production in 2025 and could be a game-changer for the company.
Moreover, auto industry giant Tesla, Inc. (TSLA) is on track to adopt TSM’s 3nm chips in 2024, underpinning a growing demand for the company’s chips. As TSLA joins TSM’s N3P customer list, reflecting a strategic win for both companies, the chip company’s revenue growth trajectory should receive a boost.
TSM’s stock closed the last trading session at $104.45, higher than the 50-day moving average of $96.08 and 200-day moving average of $93.94, underscoring a strong momentum in its stock prices.
Under such circumstances, TSM’s prospects appear bright, which should make the stock appealing to potential investors. Let’s look at the trends of its key financial metrics to gain further insight.
Analyzing Financial Performance and Market Trends of Taiwan Semiconductor Manufacturing Company Limited
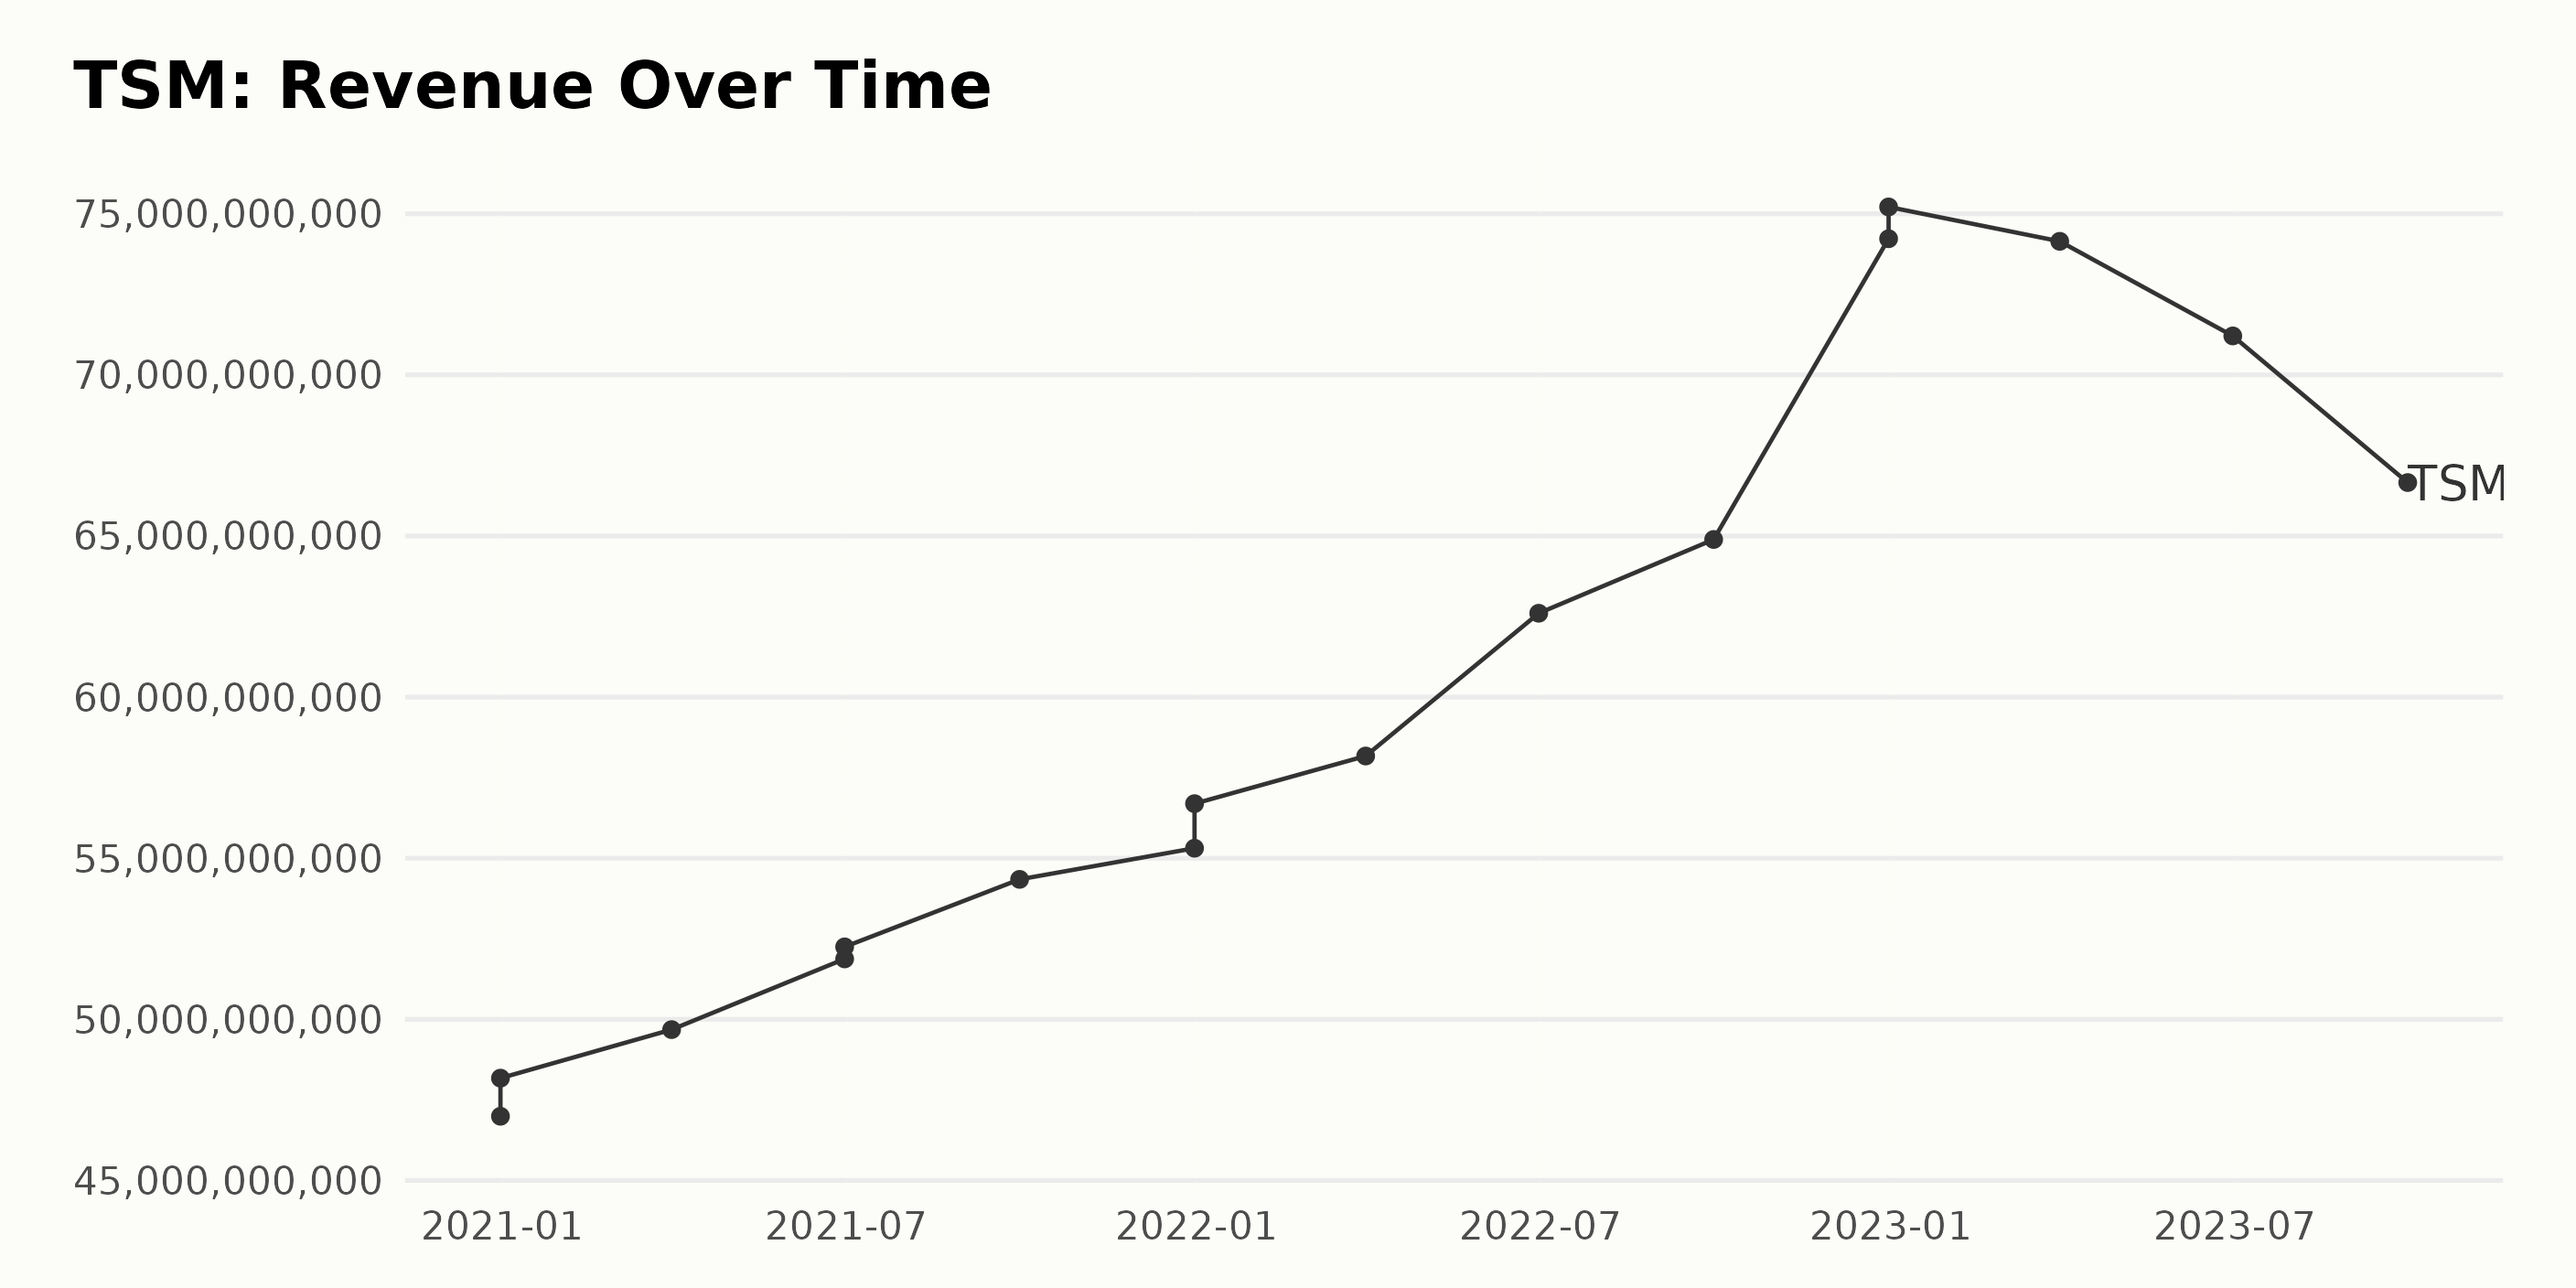
The following are the trends and fluctuations of the trailing-12-month revenue of TSM:
- As of December 2020, TSM reported a revenue of $46.99 billion, which slightly increased to $48.17 billion within the same month.
- In the first quarter of 2021 (March 31), there was a minor increase in revenue to $49.68 billion. The trend continued upwards throughout the entire year of 2021, with revenue standing at $52.25 billion (June), $54.34 billion (September), and a slightly higher growth rate toward the end of the year as it hit $56.69 billion in December.
- The year 2022 showed significant strides in growth. Starting with a revenue figure of $58.17 billion in March, a leap to $62.6 billion by the end of June, and another slight increase to $64.89 billion in September. This rapid growth rate intensified in December, when the revenue ascended to $75.21 billion, marking the highest record in this period.
- However, in 2023, a downward trend became apparent, starting at $74.15 billion in March, further dropping to $71.21 billion in June, and finishing the third quarter at $66.66 billion in September.
In summary, TSM’s financial trends show a positive growth rate from December 2020 until December 2022, followed by a downturn heading into 2023. From the initial value in December 2020 to the last recorded value in September 2023, revenue demonstrated a notable growth rate, albeit with some levels of volatility.
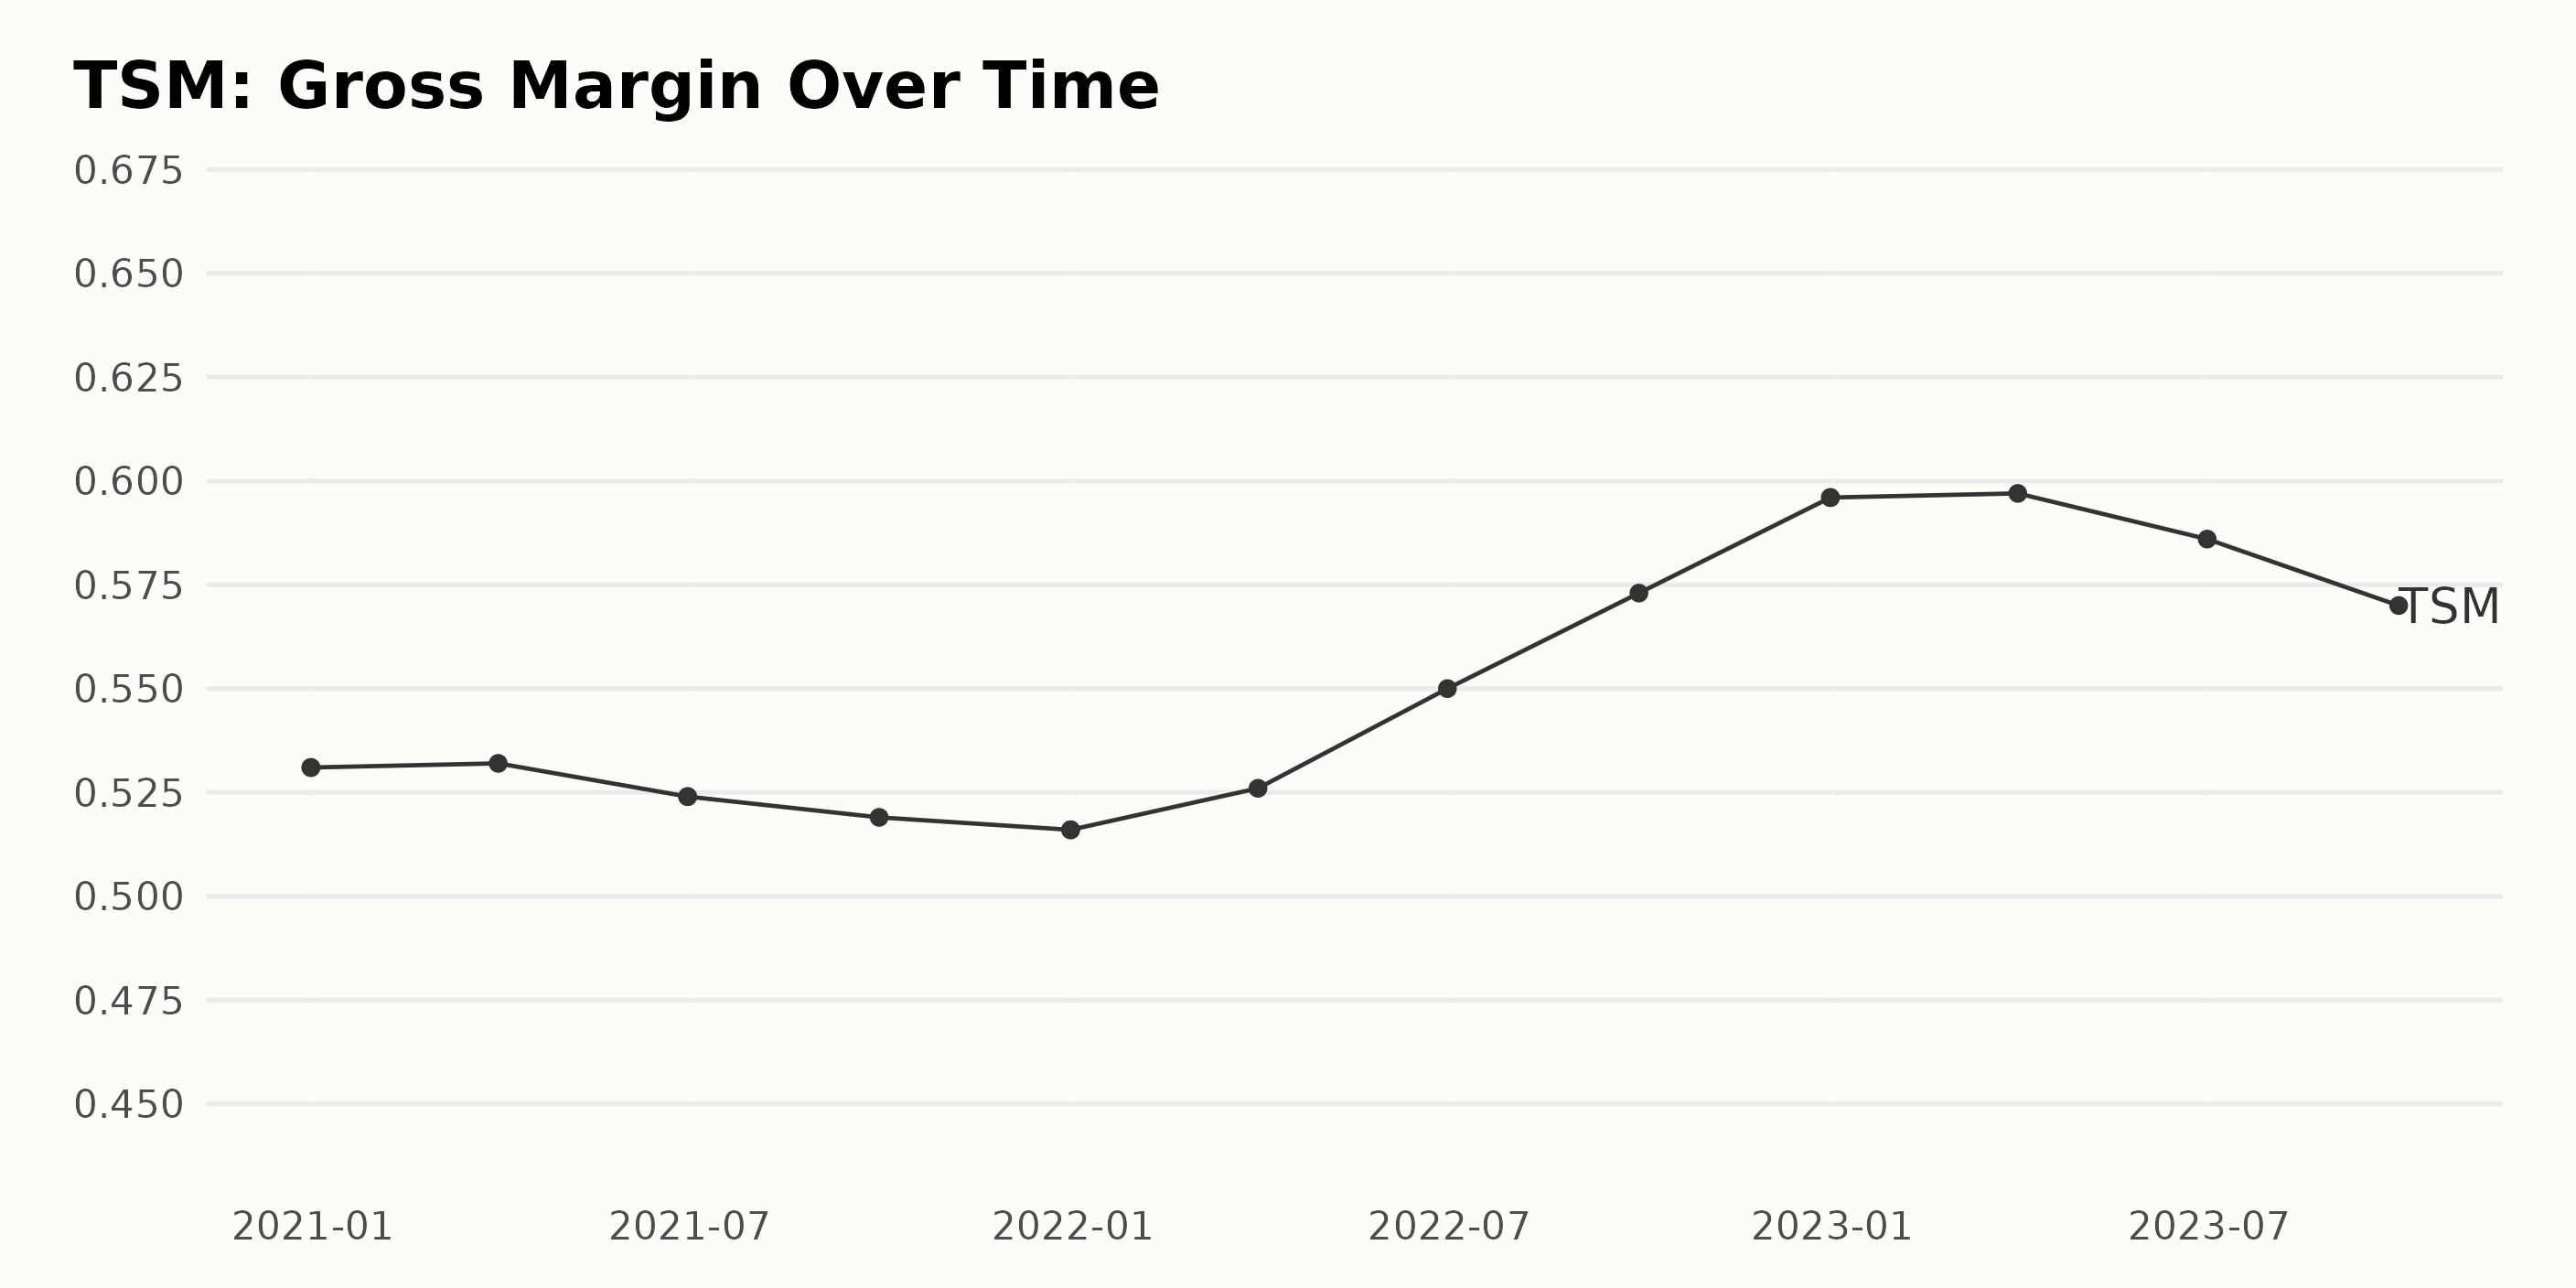
The trend of the gross margin for TSM has generally been increasing over the course of the data provided. Here are significant observations:
- In December 2020, the gross margin stood at 53.1%.
- By the end of March 2021, there was a slight increase to 53.2%, but this trend did not continue in the subsequent quarters, with a drop to 52.4% in June 2021 and a further decline to 51.9% in September 2021.
- The lowest point was reached in December 2021, where the gross margin fell to 51.6%.
- However, from the start of 2022, TSM experienced consistent growth in gross margin. It rose to 52.6% in March 2022, 55% in June 2022 and then 57.3% by September 2022.
- The peak was witnessed at the end of 2022, reaching 59.6%.
- In 2023, although the margin slightly increased to 59.7% in March, it experienced a decline in the following months, falling to 58.6% in June and then 57% in September.
In summary, the gross margin for TSM fluctuated over time but saw a net overall growth of approximately 4.9% between December 2020 and September 2023.
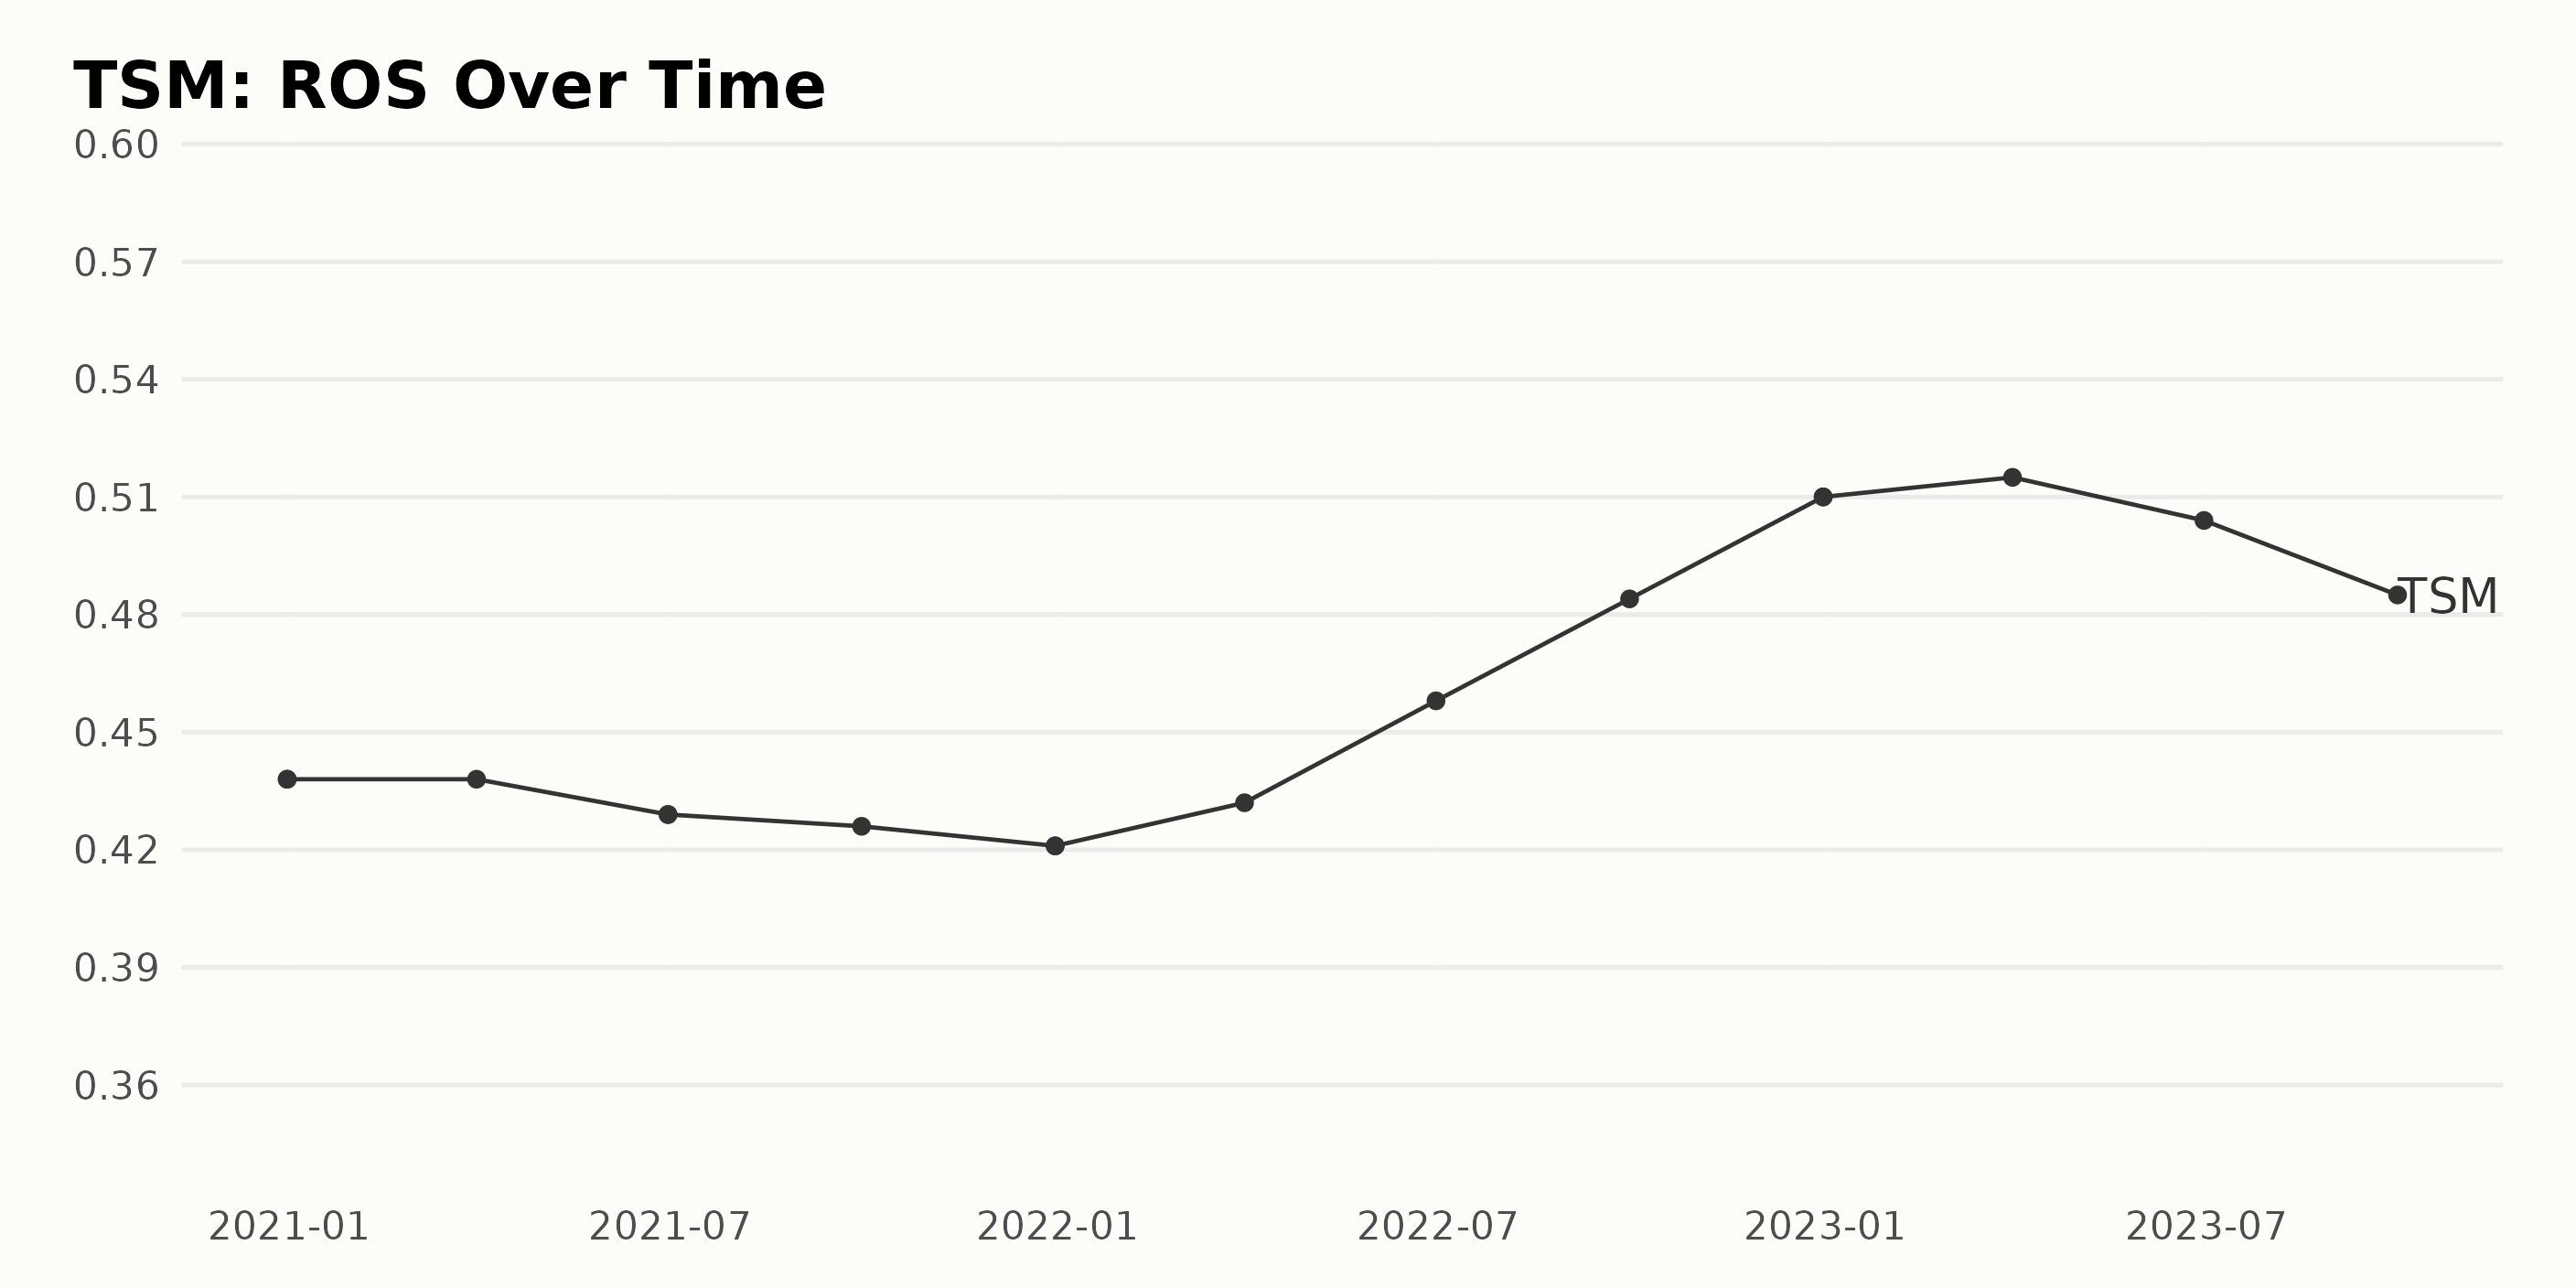
The trend and fluctuations in the Return on Sales (ROS) of TSM are as follows:
- Starting from the end of December 2020, TSM's ROS was reported at 0.44.
- There was a consistent value of 0.44 till March 2021.
- A slight decrease was observed in the subsequent quarters, with 0.43 in June 2021 and further decreasing to 0.42 in September and December 2021.
- The first quarter of 2022 saw an uptick in the ROS back to 0.43, indicating the beginning of an upward trend.
- The steady quarterly increase continued through the rest of 2022. From 0.46 in June, culminating at 0.51 by the end of the year in December 2022.
- However, the upward journey was short-lived; in 2023, a clear downward trend commenced. A slightly diminished ROS of 0.50 was reported in June 2023, further dropping to 0.49 by the end of September 2023.
Calculating the growth rate from the values of the last (September 2023 - 0.49) and the first (December 2020 - 0.44), we can see an overall increase of approximately 11% over the period under consideration.
It is important to put greater emphasis on the more recent data. Notably, the last three quarters (from January 2023 to September 2023) have seen a steady downward trend from 0.51 to 0.49. This contrasts with the strong upward trend seen throughout 2022.
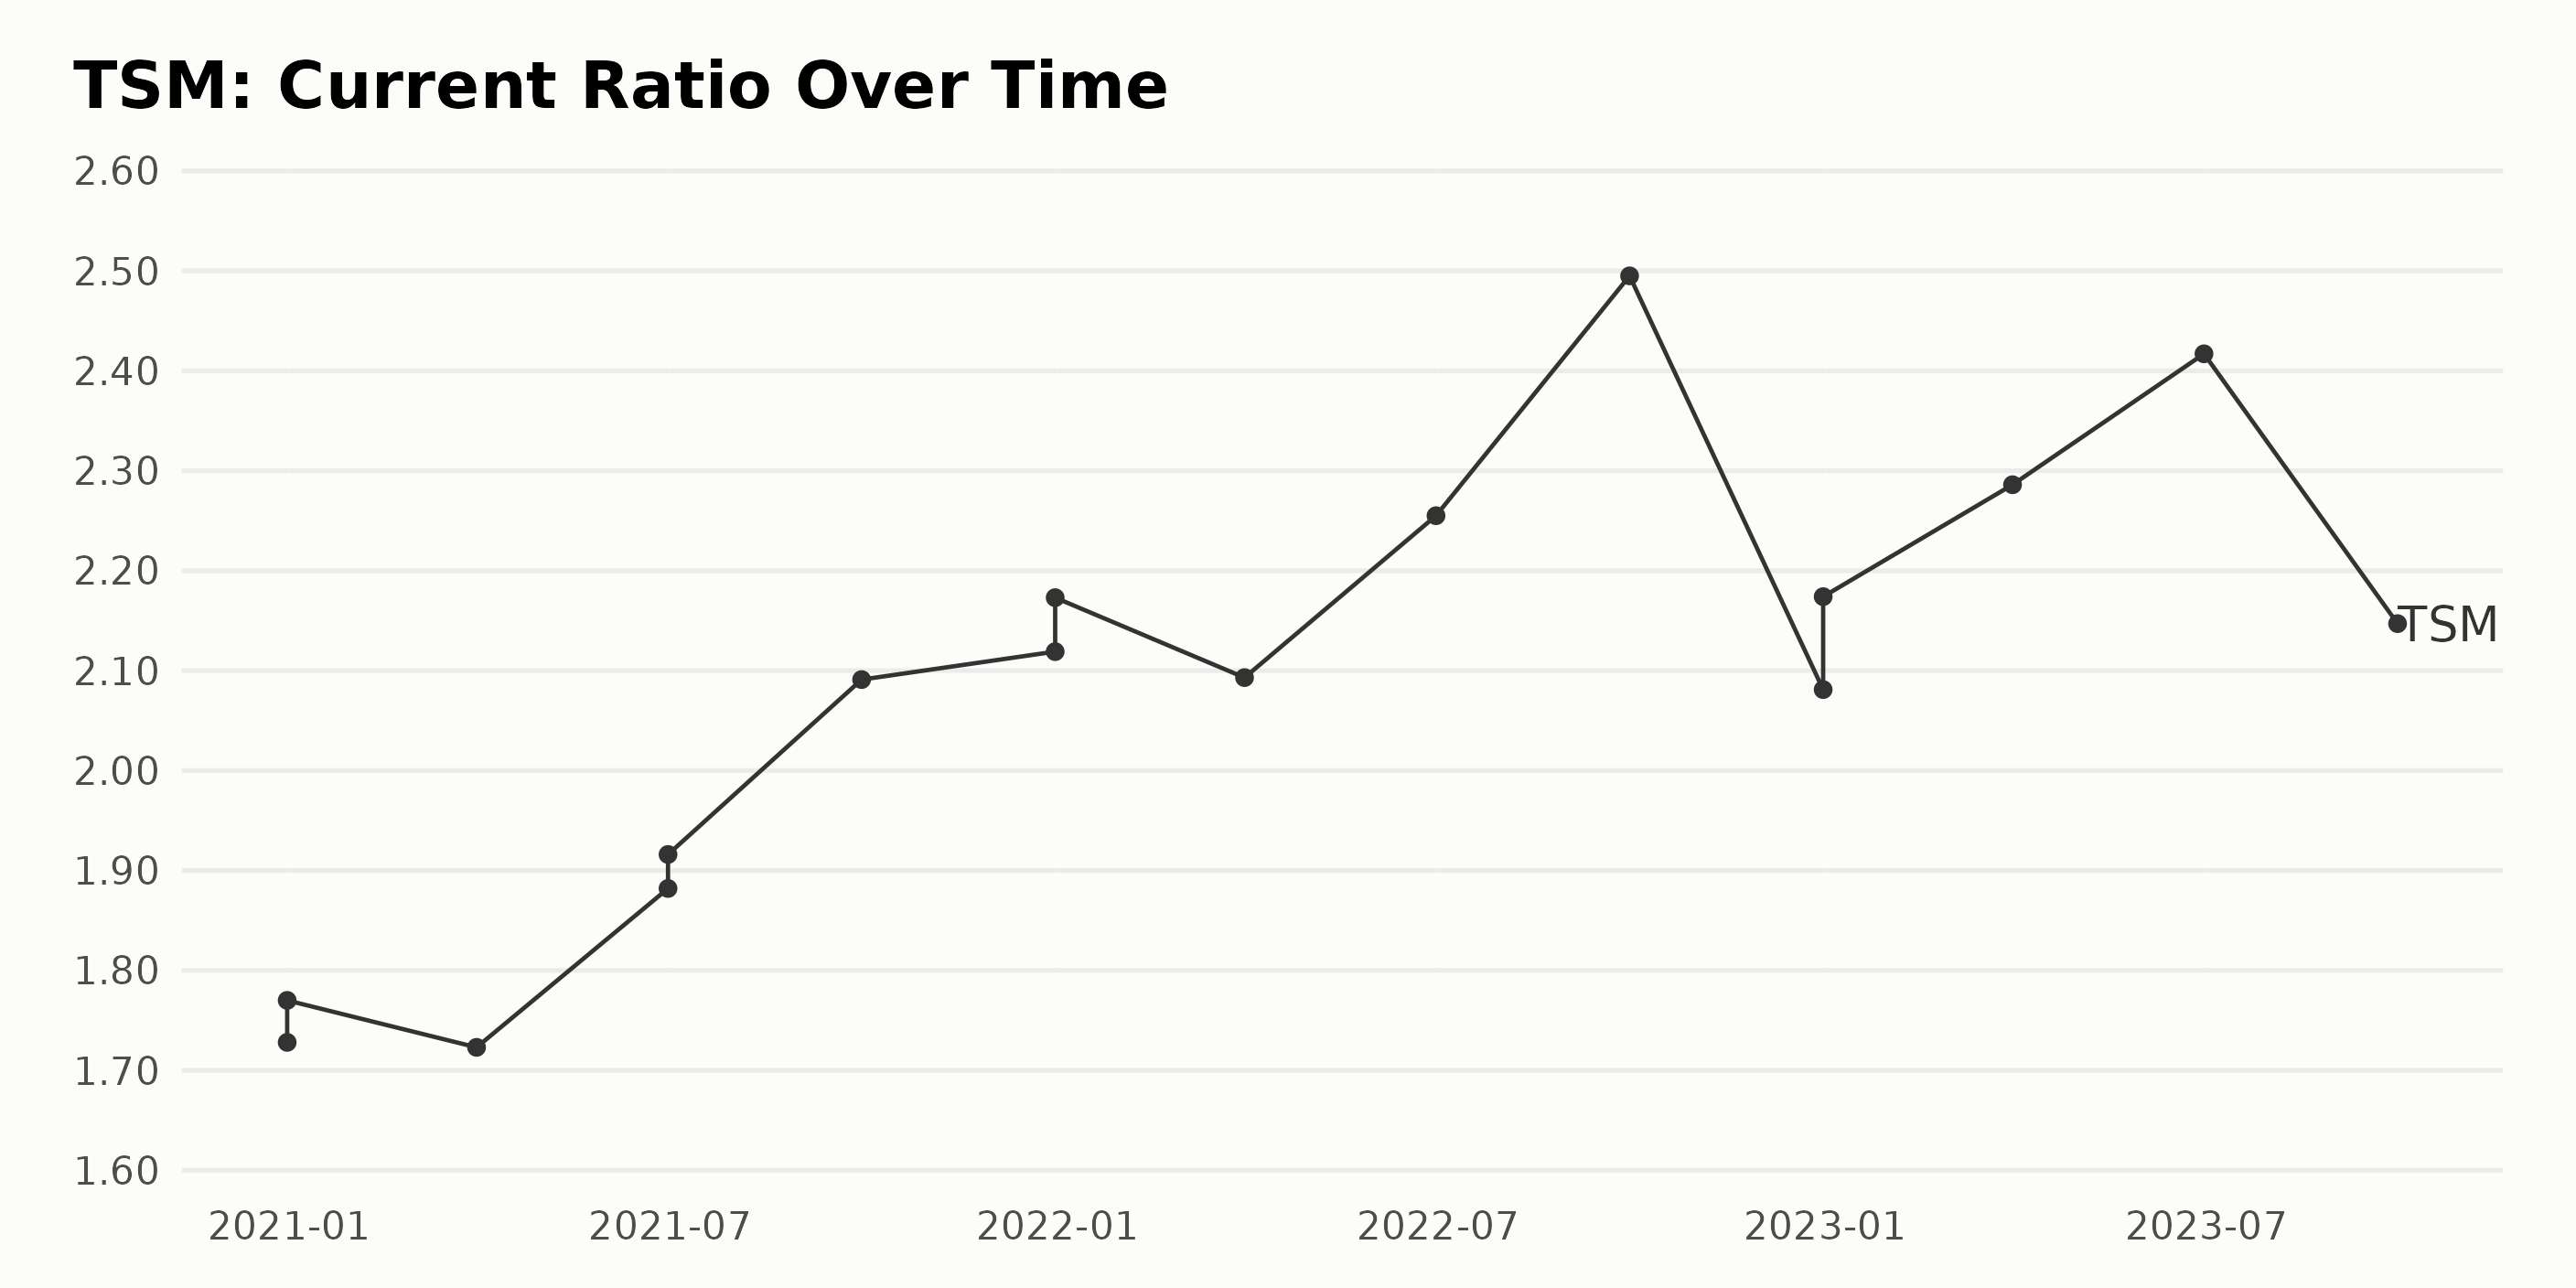
Summary of current ratio Trends for TSM:
- TSM's current ratio recorded a significant increase over the observed period, growing from 1.73 as of December 31, 2020, to 2.15 by the end of the third quarter in 2023.
- The growth rate of the current ratio, measured by the change in the last value compared to the first, indicates a significant growth of approximately 24.28%.
- Throughout the period, there have been fluctuations in the current ratio. Specifically, in the first quarter of each year, slight dips have been observed, followed by increases in the second quarter.
- Despite these fluctuations, a consistent overall upward trend has emerged. The peak was reached in the third quarter of 2022 when the current ratio hit 2.49.
- Greater emphasis on more recent data reveals that for most of 2023, the current ratio has been above 2. Noteworthy is the drop from 2.42 in June 2023 to 2.15 in September 2023, a quarterly decrease of 11.23%, illustrating the volatility of this ratio.
In summary, TSM has shown an overall upward trend in the current ratio over the historical period, indicating an improving liquidity condition.
Analyzing Taiwan Semiconductor's Share Price Volatility: June - December 2023
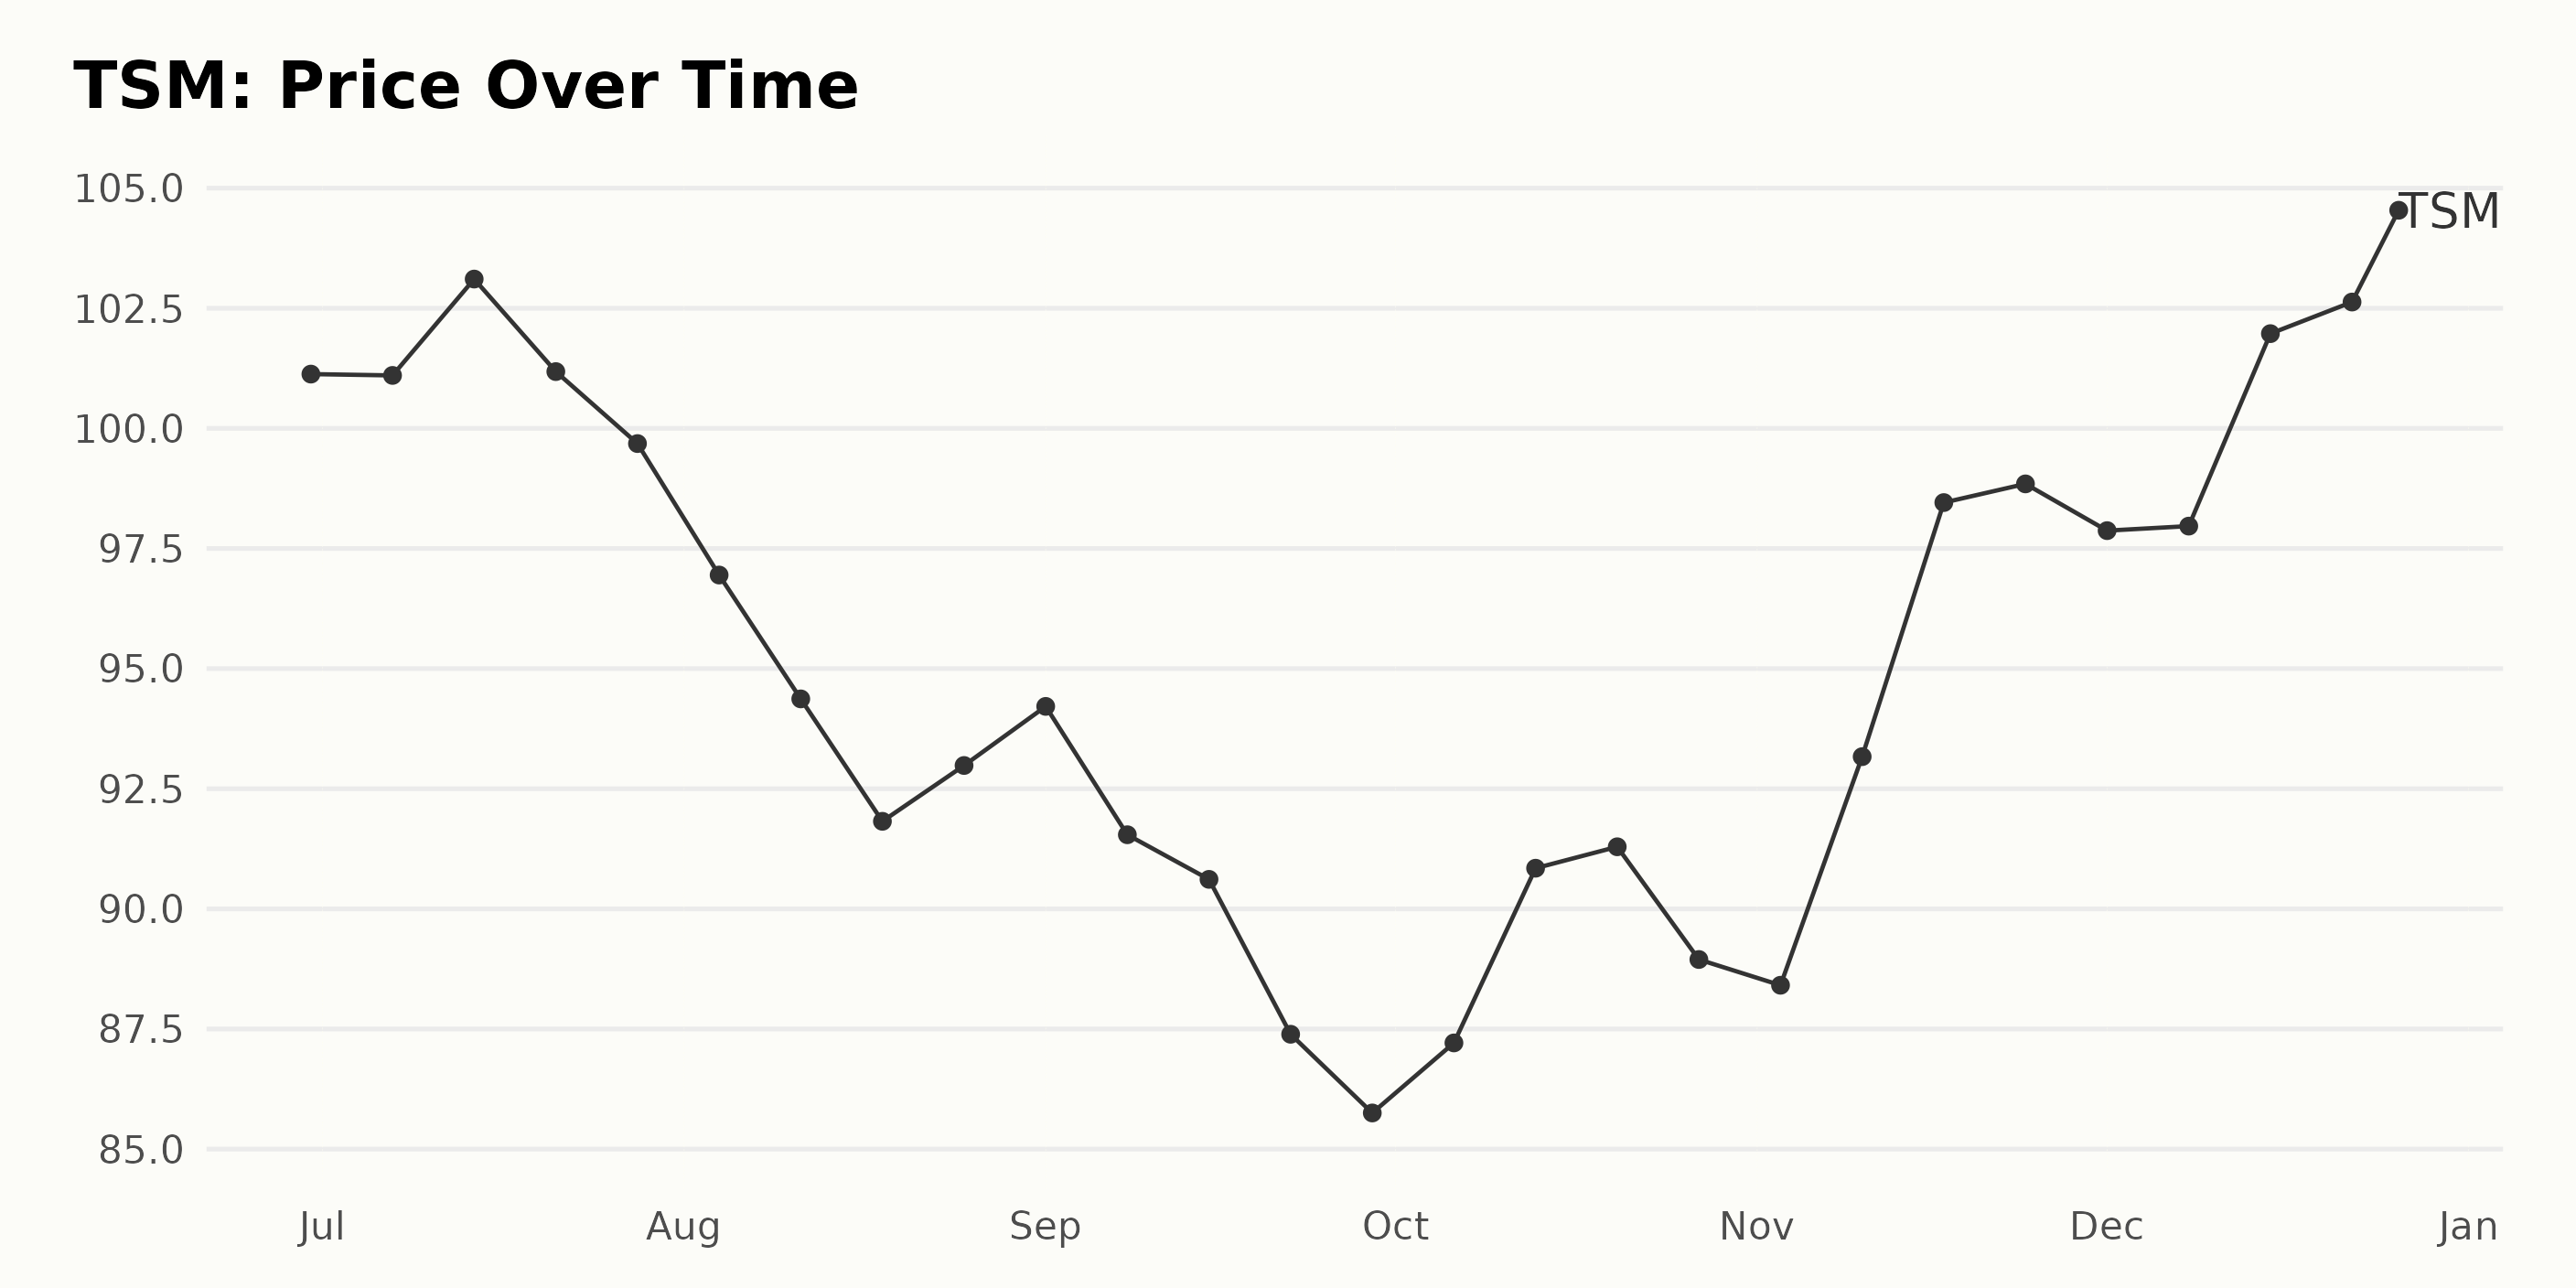
Based on the data provided, the share price of TSM underwent a varying trend between June 2023 and December 2023:
- At the beginning of this period, on June 30, 2023, the price was $101.13.
- The share price slightly declined to $101.10 by July 7, 2023, but rose to $103.11 by July 14, 2023. From then, a clear decelerating trend was observed until August 18, 2023, when the share price fell to $91.82.
- Thereafter, there was a slight increase to $94.21 by September 1, 2023, after which the price again decreased to its lowest point of $85.75 on September 29, 2023.
- Subsequently, there was a gradual and almost consistent rise in the share price, reaching as high as $102.63 on December 22, 2023.
- The year ended on a high note, with the share price of TSM reaching its peak at $104.45 on December 26, 2023.
In general, the growth rate of TSM's share price initially decreased from June 2023 to September 2023. However, from September 2023, an accelerating upward trend was observed that continued through the end of the year. Here is a chart of TSM's price over the past 180 days.
Analyzing the Momentum, Quality, and Sentiment Ratings of TSM in 2023
Based on the provided data, TSM, a stock in the 91-stock Semiconductor & Wireless Chip category, has shown fluctuations in its POWR Ratings grade over several months from July to December of 2023. Here are some key observations:
- Throughout most of July and August 2023, TSM maintained a grade of B (Buy). However, it did witness a temporary decline to C (Neutral) near the end of July, which continued until mid-August.
- The stock recovered its B (Buy) grade by August 19, 2023, improving its rank within the category from #32 to #20.
- TSM's performances stayed steady through most of September 2023, with an occasional dip in performance to C (Neutral) on one week of September 23.
- From late September through the rest of the year, TSM sustained a consistent B (Buy) grade, showing a good standing within its category.
- TSM's ranking within its category mostly hovered between #15 and #21. In the final month of 2023, TSM showed strong performance within its category.
- As of the last available record, dated December 27, 2023, TSM held a B (Buy) POWR grade and was ranked #16 in the Semiconductor & Wireless Chip category.
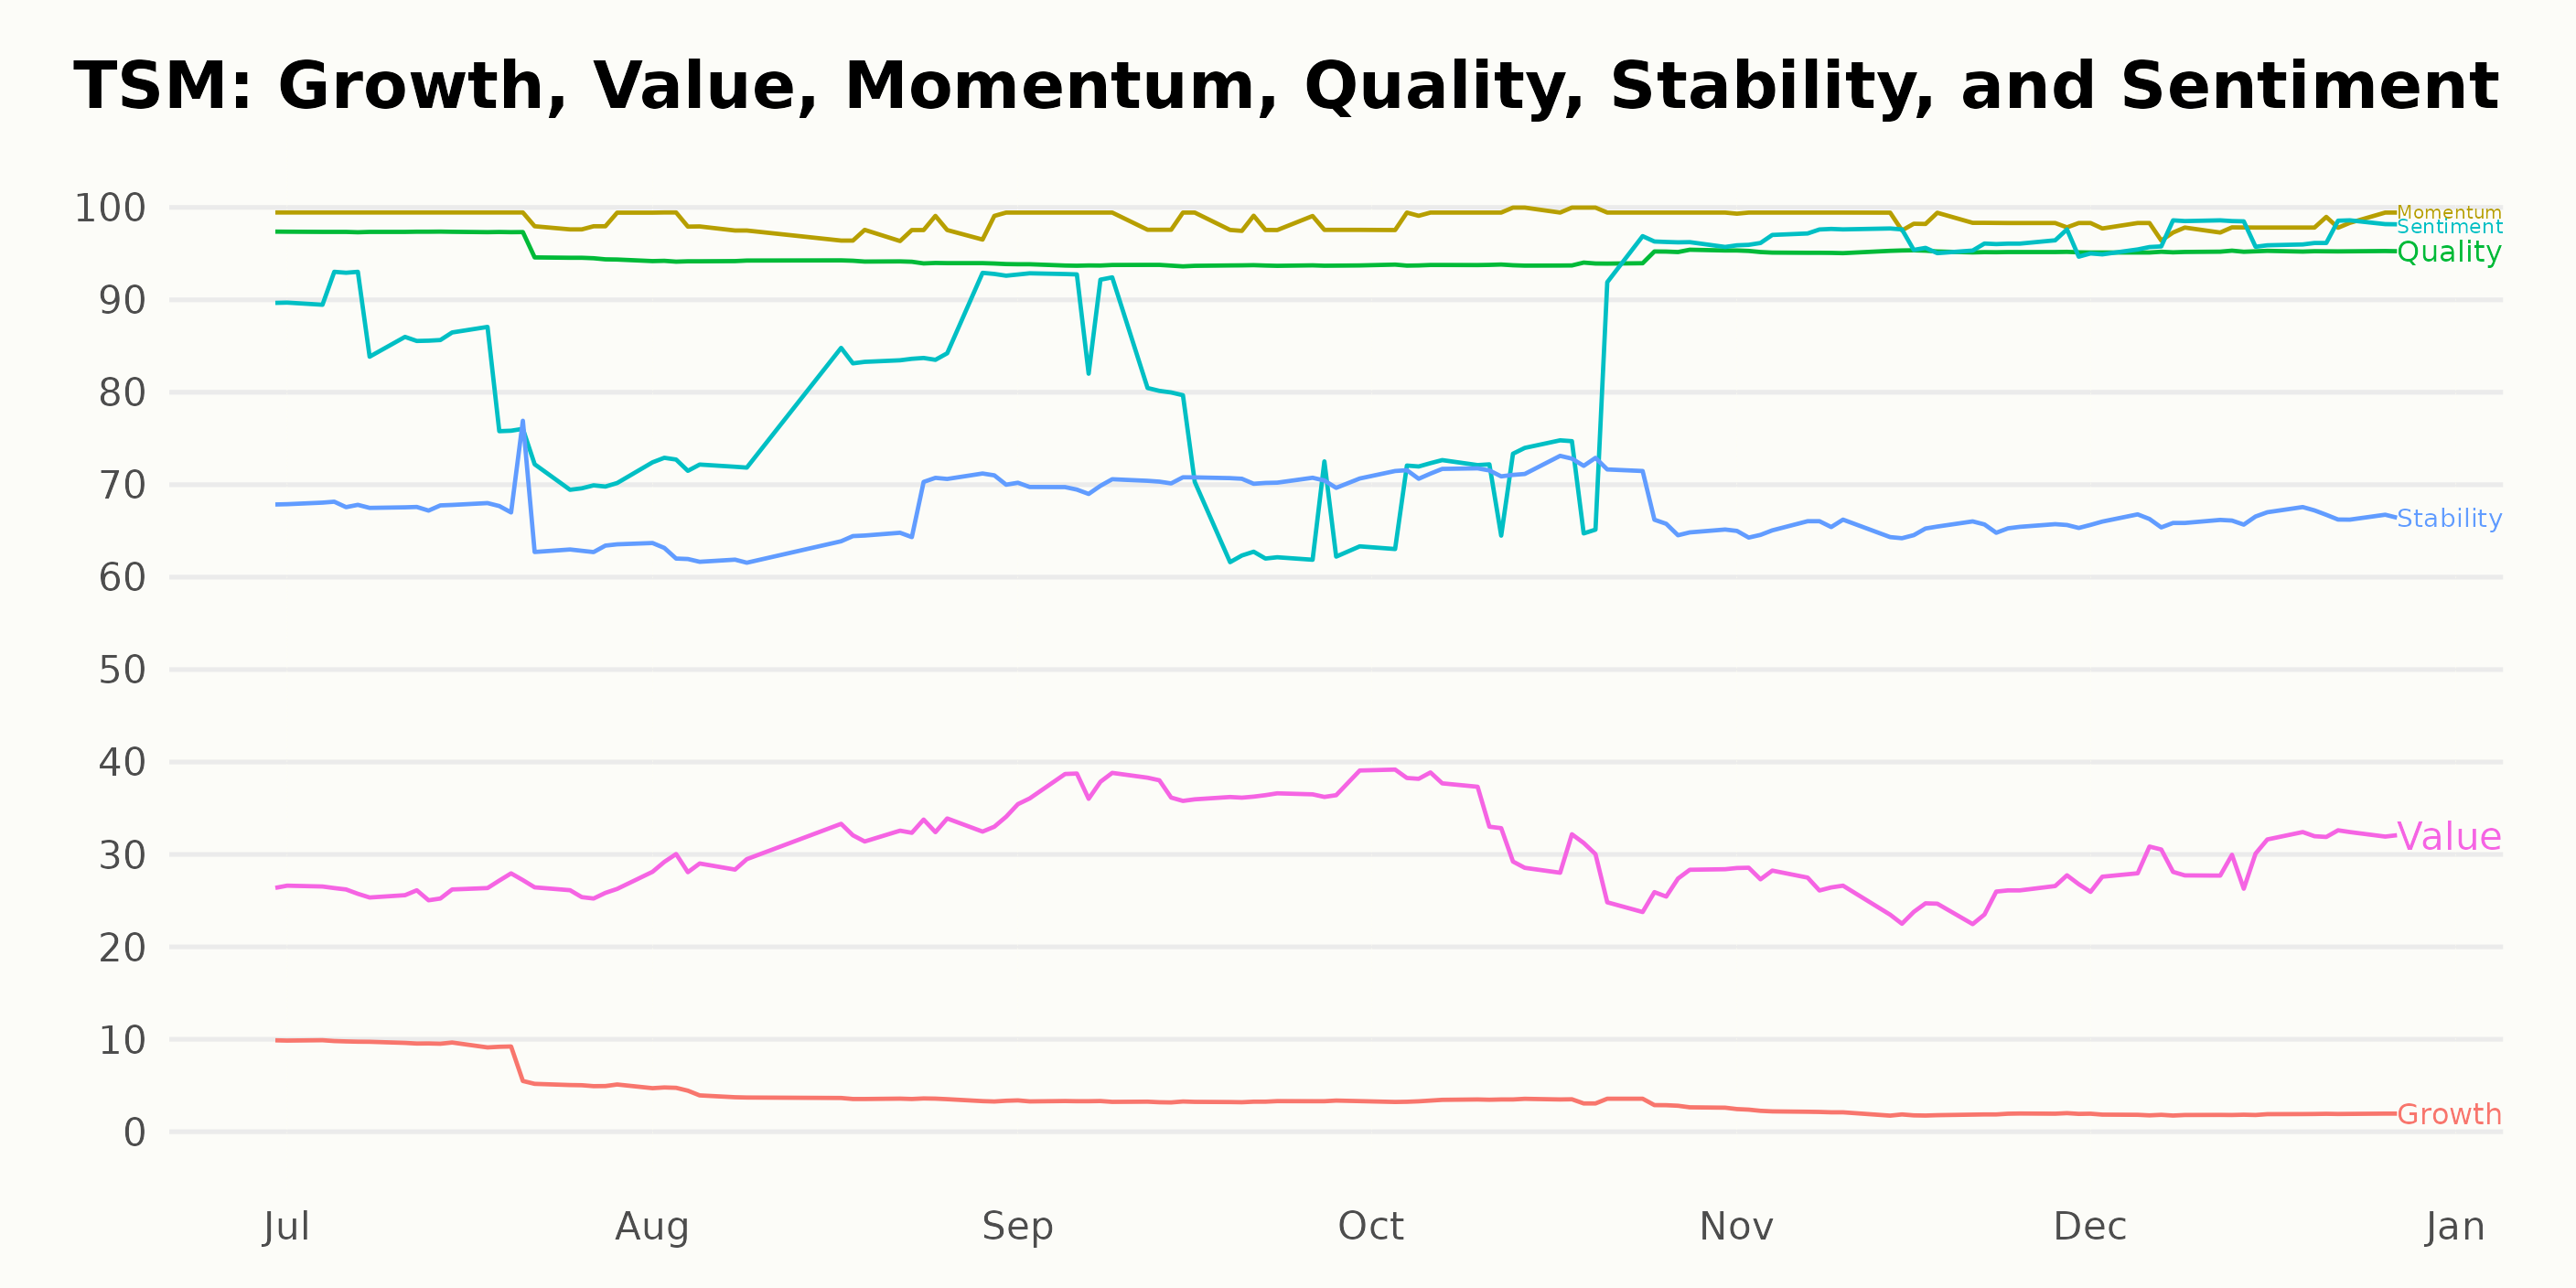
Over the duration from June 2023 to December 2023, TSM has performed quite distinctively across various dimensions of the POWR Ratings. Focusing on the three most noteworthy dimensions, namely Momentum, Quality and Sentiment, we have found some interesting patterns.
Momentum: This dimension consistently scored extremely high for TSM. Starting with a value of 99 in June 2023, the rating remained steady almost throughout the year, suffering only a slight dip to 98 from August to December 2023.
Quality: Quality started at 97 in June 2023, maintaining this score until July of the same year. This slightly decreased to 94 in August 2023, with a subtle shift upward to 95 by November 2023. It maintained this level through December of the year.
Sentiment: The Sentiment rating exhibited the most fluctuation among the significant dimensions. Starting strong with a value of 90 in June 2023, the sentiment rating dropped to 81 by July and maintained that score until August. The rating bounced between 76 and 79 from September to October, then steeply increased to 96 in November and continued to rise to 97 by December.
Through examination of these three dimensions, it’s clear that TSM maintained an exceptional Momentum profile and quite a stable Quality rating throughout the six months built into our data set. On the other hand, Sentiment toward the company seemed more variable throughout the period.
How does Taiwan Semiconductor Manufacturing Company Limited (TSM) Stack Up Against its Peers?
Other stocks in the Semiconductor & Wireless Chip sector that may be worth considering are ChipMOS TECHNOLOGIES INC. (IMOS), Everspin Technologies, Inc. (MRAM), and Photronics, Inc. (PLAB) - they have better POWR Ratings. Click here to explore more Semiconductor & Wireless Chip stocks.
What To Do Next?
Get your hands on this special report with 3 low priced companies with tremendous upside potential even in today’s volatile markets:
3 Stocks to DOUBLE This Year >
TSM shares were trading at $104.46 per share on Wednesday morning, up $0.01 (+0.01%). Year-to-date, TSM has gained 42.38%, versus a 26.32% rise in the benchmark S&P 500 index during the same period.
About the Author: Anushka Dutta

Anushka is an analyst whose interest in understanding the impact of broader economic changes on financial markets motivated her to pursue a career in investment research.
The post TSM 2024 Insights: A Momentum Stock to Buy? appeared first on StockNews.com