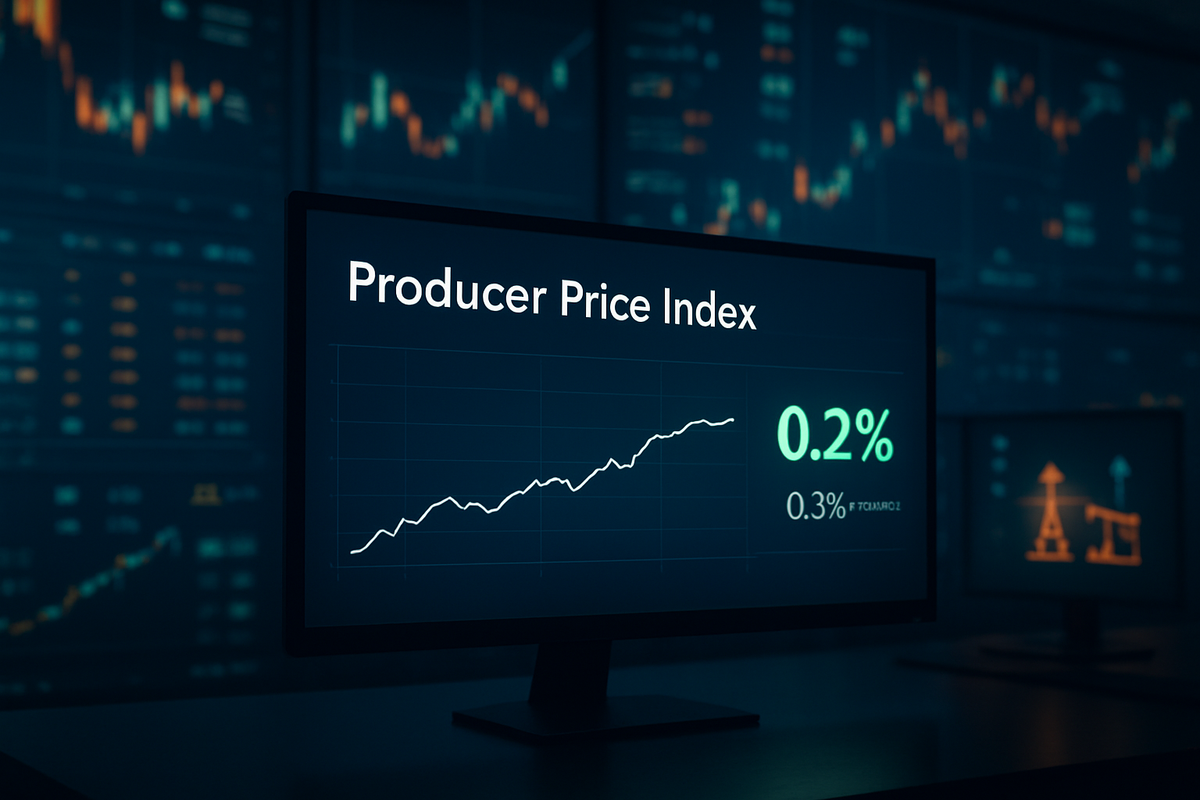
The latest wholesale inflation data has provided a complex puzzle for Wall Street and the Federal Reserve alike. In a report released this week, the Producer Price Index (PPI) for November showed that wholesale prices rose by 0.2%, coming in slightly below the 0.3% increase that economists had widely anticipated. While the lower-than-expected monthly headline figure initially sparked optimism regarding a cooling economy, underlying data reveals a persistent tug-of-war between surging energy costs and a stagnant services sector, complicating the Federal Reserve’s outlook for early 2026.
The immediate implication of this "mixed" report has been a swift recalibration of market expectations. With the January 27–28 Federal Open Market Committee (FOMC) meeting fast approaching, the cooler monthly PPI print initially suggested room for monetary easing. However, as investors peeled back the layers to find an annual inflation rate that has climbed back to 3.0%, the narrative shifted from a potential rate cut to a "higher-for-longer" stabilization phase. The divergence between monthly momentum and annual stickiness has left the market in a state of cautious rotation, as participants weigh the benefits of slowing service costs against the burden of high energy overheads.
Deciphering the November Data: Energy Surges While Services Stall
The November PPI report, which saw a delay in its release due to the 43-day federal government shutdown, offered a granular look at the inflationary pressures currently facing U.S. producers. The 0.2% monthly rise in headline PPI was largely driven by a massive spike in energy prices, which jumped 4.6% in November alone. Gasoline prices soared 10.5%, while diesel fuel—a critical input for the nation's logistics and manufacturing sectors—climbed a staggering 12.4%. According to the Bureau of Labor Statistics, energy accounted for more than 80% of the total increase in producer goods prices for the month.
Counterbalancing this energy-driven surge was a notable cooling in the services sector. Final demand services remained flat (0.0%) for the month, a sharp deceleration from the 0.3% rise seen in October. This stability in services was a primary reason the headline figure missed the 0.3% forecast. Furthermore, Core PPI—which excludes the volatile food and energy categories—remained unchanged at 0.0%, significantly lower than the 0.2% increase markets had prepared for. This lack of growth in core prices suggests that while the "cost of living" (driven by energy) is rising, the "cost of doing business" in the services industry is reaching a plateau.
Despite the monthly cooling, the year-over-year (YoY) figures told a more cautionary tale. Headline PPI rose to 3.0% YoY, up from 2.8% in October, marking the first time the index has touched the "3-handle" since late 2025. Even more concerning for the Fed was the "Super-Core" PPI, which excludes food, energy, and trade services; this metric climbed 3.5% YoY. This suggests that while individual months may show volatility or temporary dips, the broader inflationary trend remains stubbornly above the Federal Reserve’s 2% target.
Market Winners and Losers: A Rotation into Value and Cyclicals
The PPI report triggered a definitive rotation within the equity markets, favoring "Old Economy" value stocks over high-growth tech giants. ExxonMobil (NYSE: XOM) emerged as a primary beneficiary of the report’s internal dynamics. As wholesale energy prices surged, shares of the oil giant jumped nearly 3% to reach an all-time high of $130.20 on the day of the release. Investors bet that the 4.6% rise in energy PPI would translate directly into stronger margins for upstream and downstream energy producers.
The logistics and industrial sectors also showed surprising resilience. FedEx (NYSE: FDX) and United Parcel Service (NYSE: UPS) both saw gains as the market rotated into industrials, with FedEx reaching its own all-time high of $313.55. While higher diesel costs typically serve as a headwind for these companies, the broader shift toward cyclical stocks—driven by the belief that the economy remains robust enough to handle higher energy costs—buoyed their share prices. Analysts noted, however, that trade margins for wholesalers and retailers dropped 0.8%, signaling that these firms are currently eating some of the increased transport costs rather than passing them all to consumers.
On the losing side of the ledger were the "Magnificent Seven" and other rate-sensitive growth stocks. Amazon (NASDAQ: AMZN) shares fell 2.45% following the report, as the "Super-Core" inflation reading of 3.5% led traders to "price out" the possibility of an interest rate cut in January. Similarly, Apple (NASDAQ: AAPL) saw its valuation pressured by rising Treasury yields, as the fixed-income market reacted to the sticky 3.0% annual inflation rate. For tech companies, which rely on low discount rates for their future cash flows, the prospect of the Fed holding rates at 3.50%–3.75% for longer than anticipated served as a significant drag on performance.
The Significance of "K-Shaped" Disinflation and the Fed’s Next Move
This PPI report highlights a growing trend of "K-shaped" disinflation in the American economy. On one hand, the services sector is finally showing the effects of the Federal Reserve’s restrictive monetary policy, with price growth stalling. On the other hand, goods inflation—specifically energy and fuels—is being reignited by geopolitical tensions and shifting domestic trade policies. This divergence makes the Fed's job increasingly difficult; cutting rates to support a softening service economy could risk further fueling the commodity-driven inflation that is already pushing the headline YoY numbers upward.
Historically, periods where PPI exceeds CPI (Consumer Price Index) have signaled a squeeze on corporate profit margins. If producers like Amazon (NASDAQ: AMZN) or Walmart (NYSE: WMT) cannot pass these 10%+ increases in fuel and diesel costs onto consumers, their quarterly earnings could suffer in the first half of 2026. The current environment mirrors the mid-1970s and early 1980s, where "echoes" of inflation forced the central bank to maintain high rates even as certain sectors of the economy appeared to be cooling.
The regulatory and policy implications are also coming into focus. With the 2026 political landscape shifting, there is increased talk of tariffs and trade barriers that could add an estimated 0.3 to 0.5 percentage points to future PPI readings. The Federal Reserve, led by Chair Jerome Powell, is likely to view the November PPI data as a reason to remain "patient." The market's probability for a rate "hold" in late January has now surged to over 95%, as the "wait-and-see" approach becomes the dominant consensus among policymakers.
Navigating the "Higher-for-Longer" Reality
Looking ahead, the short-term outlook for the market is one of volatility and consolidation. Investors should expect a continued tug-of-war between the "Goldilocks" scenario—where services inflation remains zero—and the "Re-inflation" scenario driven by energy. If energy prices continue their upward trajectory through the winter months, the Fed may be forced to keep the federal funds rate in its current 3.50%–3.75% range well into the summer of 2026. Goldman Sachs and other major institutions have already pushed back their expectations for the next rate cut to March or even June 2026.
Strategic pivots will be required for both companies and investors. Manufacturers will likely double down on efficiency and automation to offset rising fuel and input costs, while retailers may need to reassess their pricing strategies to maintain margins. For investors, the "opportunity" may lie in sectors with high pricing power or those that directly benefit from higher commodity prices. Conversely, companies with high debt-to-equity ratios may face challenges as the window for refinancing at lower rates continues to shift further into the future.
Conclusion: A Balancing Act for the Months Ahead
The November PPI report is a stark reminder that the fight against inflation is far from over, even if the monthly headline number appears "cooler." The 0.2% monthly rise masks a 3.0% annual reality that the Federal Reserve cannot ignore. The key takeaway for investors is that the "last mile" of returning inflation to the 2% target is proving to be the most difficult, largely due to the volatility of the energy sector and the stickiness of "Super-Core" metrics.
Moving forward, the market will likely move away from the "everything rally" seen in late 2025 and into a more discerning, sector-specific environment. Investors should keep a close eye on the January 2026 CPI data and the Fed’s subsequent commentary on Jan 28. If the trend of stagnant services and rising energy continues, the rotation into value and energy stocks like ExxonMobil (NYSE: XOM) may have significant room to run, while Big Tech may continue to trade sideways as it adjusts to the reality of higher interest rates for the foreseeable future.
This content is intended for informational purposes only and is not financial advice.