
Homebuilder Lennar (NYSE: LEN) missed Wall Street’s revenue expectations in Q3 CY2025, with sales falling 6.4% year on year to $8.81 billion. Its GAAP profit of $2.29 per share was 9.2% above analysts’ consensus estimates.
Is now the time to buy Lennar? Find out by accessing our full research report, it’s free.
Lennar (LEN) Q3 CY2025 Highlights:
- Revenue: $8.81 billion vs analyst estimates of $9.06 billion (6.4% year-on-year decline, 2.7% miss)
- EPS (GAAP): $2.29 vs analyst estimates of $2.10 (9.2% beat)
- Operating Margin: 9.4%, down from 13.7% in the same quarter last year
- Backlog: $6.6 billion at quarter end, down 14.8% year on year
- Market Capitalization: $34.2 billion
Stuart Miller, Executive Chairman and Co-Chief Executive Officer of Lennar, said, "Our third quarter results reflect both the continued pressures of today's housing market and the consistency of Lennar's operating strategy. This quarter, we delivered 21,584 homes and recorded 23,004 new orders. Achieving these results required additional incentives, resulting in a reduced average sales price of $383,000, and our gross margin drifted down to 17.5%, while our SG&A expenses came in at 8.2%, reflecting the soft market conditions."
Company Overview
One of the largest homebuilders in America, Lennar (NYSE: LEN) is known for constructing affordable, move-up, and retirement homes across a range of markets and communities.
Revenue Growth
Reviewing a company’s long-term sales performance reveals insights into its quality. Even a bad business can shine for one or two quarters, but a top-tier one grows for years. Luckily, Lennar’s sales grew at a decent 9% compounded annual growth rate over the last five years. Its growth was slightly above the average industrials company and shows its offerings resonate with customers.
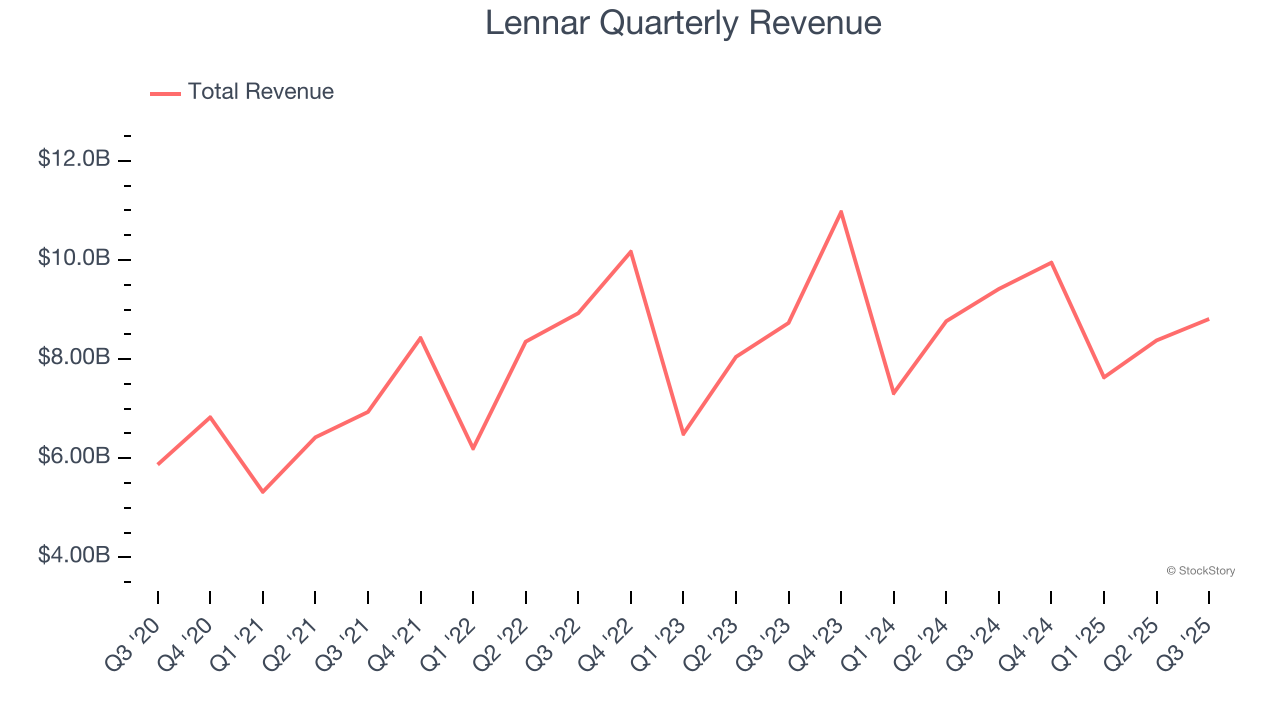
Long-term growth is the most important, but within industrials, a half-decade historical view may miss new industry trends or demand cycles. Lennar’s recent performance shows its demand has slowed as its annualized revenue growth of 2% over the last two years was below its five-year trend. 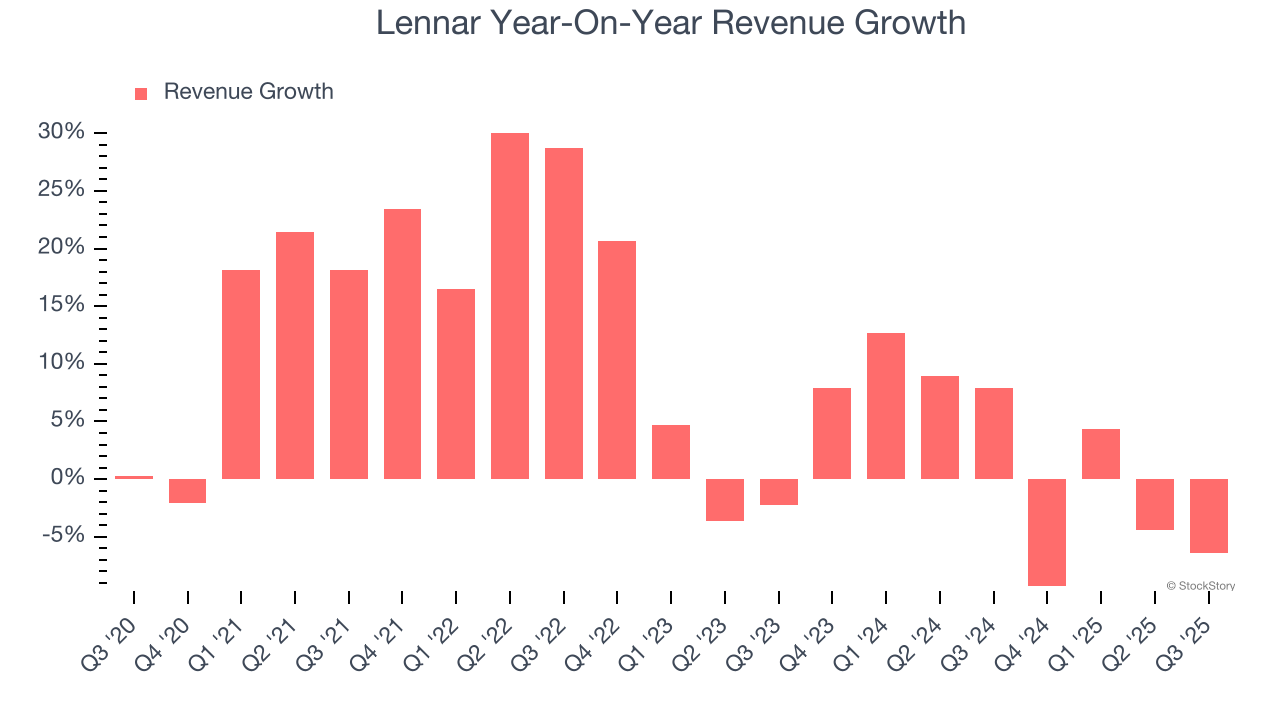
Lennar also reports its backlog, or the value of its outstanding orders that have not yet been executed or delivered. Lennar’s backlog reached $6.6 billion in the latest quarter and averaged 19.3% year-on-year declines over the last two years. Because this number is lower than its revenue growth, we can see the company hasn’t secured enough new orders to maintain its growth rate in the future. 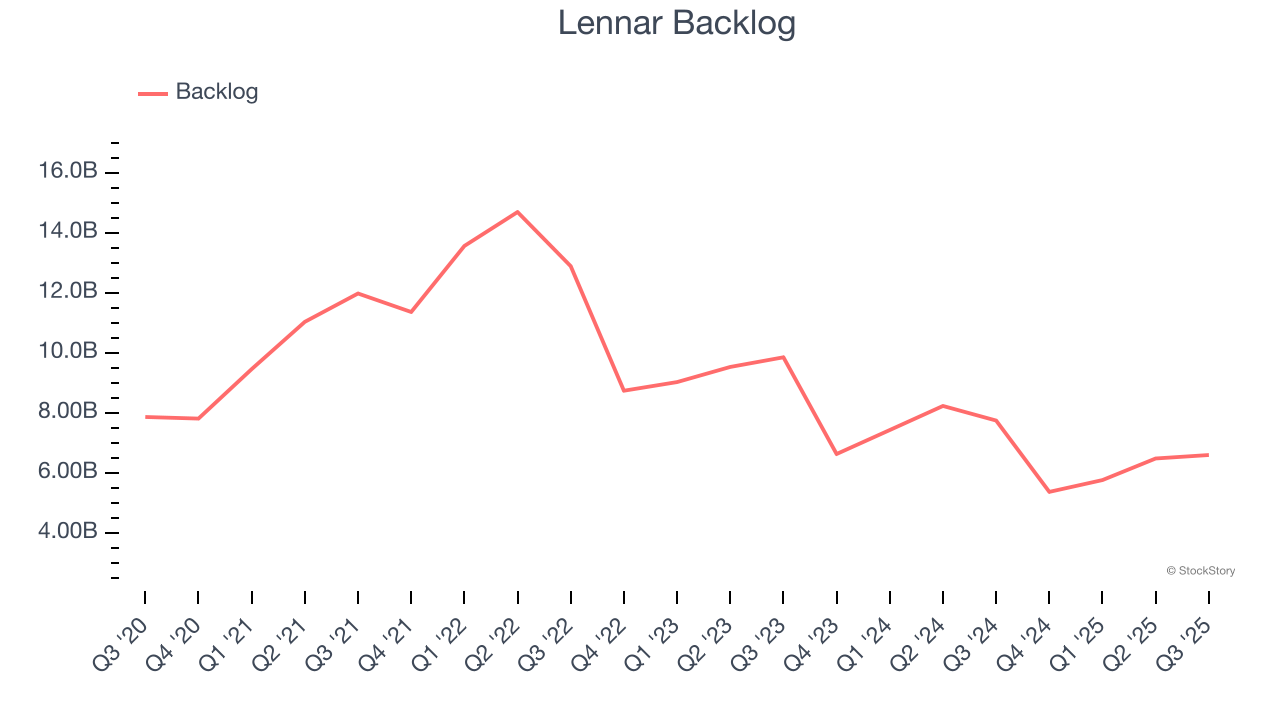
This quarter, Lennar missed Wall Street’s estimates and reported a rather uninspiring 6.4% year-on-year revenue decline, generating $8.81 billion of revenue.
Looking ahead, sell-side analysts expect revenue to grow 2.5% over the next 12 months, similar to its two-year rate. This projection is underwhelming and indicates its newer products and services will not lead to better top-line performance yet.
Here at StockStory, we certainly understand the potential of thematic investing. Diverse winners from Microsoft (MSFT) to Alphabet (GOOG), Coca-Cola (KO) to Monster Beverage (MNST) could all have been identified as promising growth stories with a megatrend driving the growth. So, in that spirit, we’ve identified a relatively under-the-radar profitable growth stock benefiting from the rise of AI, available to you FREE via this link.
Operating Margin
Operating margin is an important measure of profitability as it shows the portion of revenue left after accounting for all core expenses – everything from the cost of goods sold to advertising and wages. It’s also useful for comparing profitability across companies with different levels of debt and tax rates because it excludes interest and taxes.
Lennar has been an efficient company over the last five years. It was one of the more profitable businesses in the industrials sector, boasting an average operating margin of 15.6%. This result was particularly impressive because of its low gross margin, which is mostly a factor of what it sells and takes huge shifts to move meaningfully. Companies have more control over their operating margins, and it’s a show of well-managed operations if they’re high when gross margins are low.
Looking at the trend in its profitability, Lennar’s operating margin decreased by 7.4 percentage points over the last five years. This raises questions about the company’s expense base because its revenue growth should have given it leverage on its fixed costs, resulting in better economies of scale and profitability.
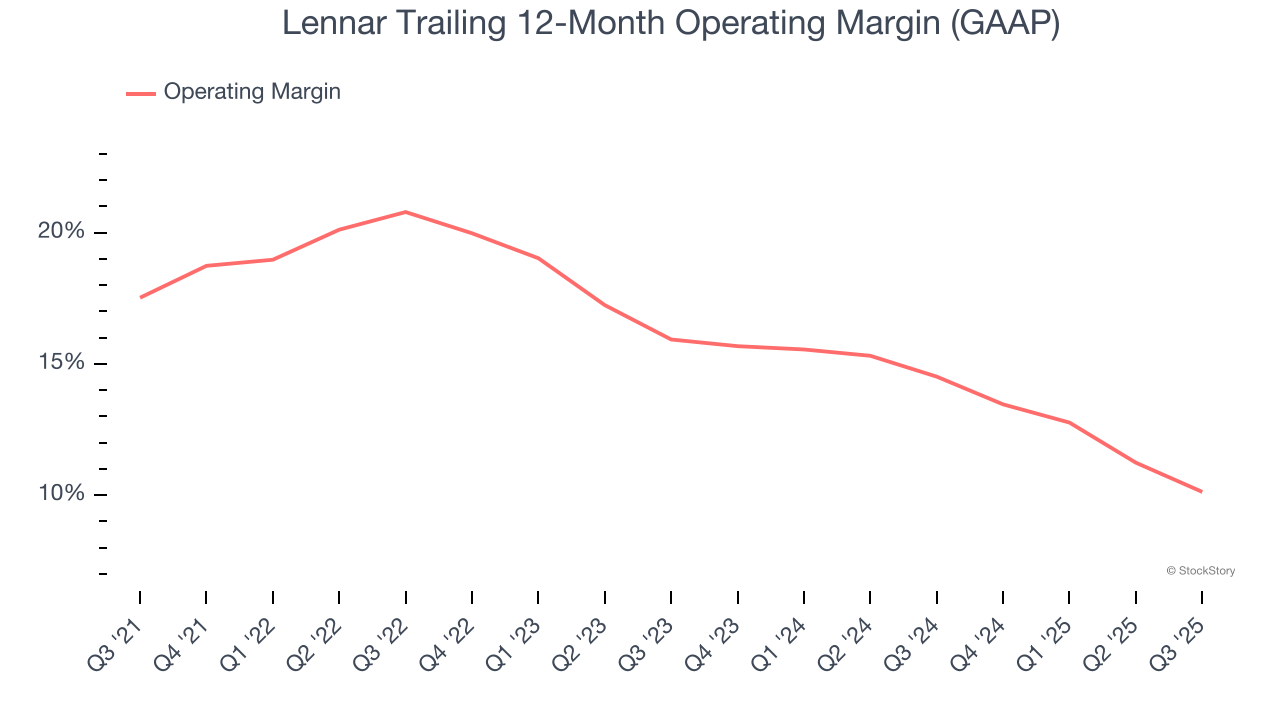
This quarter, Lennar generated an operating margin profit margin of 9.4%, down 4.2 percentage points year on year. Since Lennar’s operating margin decreased more than its gross margin, we can assume it was less efficient because expenses such as marketing, R&D, and administrative overhead increased.
Earnings Per Share
Revenue trends explain a company’s historical growth, but the long-term change in earnings per share (EPS) points to the profitability of that growth – for example, a company could inflate its sales through excessive spending on advertising and promotions.
Lennar’s unimpressive 7% annual EPS growth over the last five years aligns with its revenue performance. This tells us it maintained its per-share profitability as it expanded.
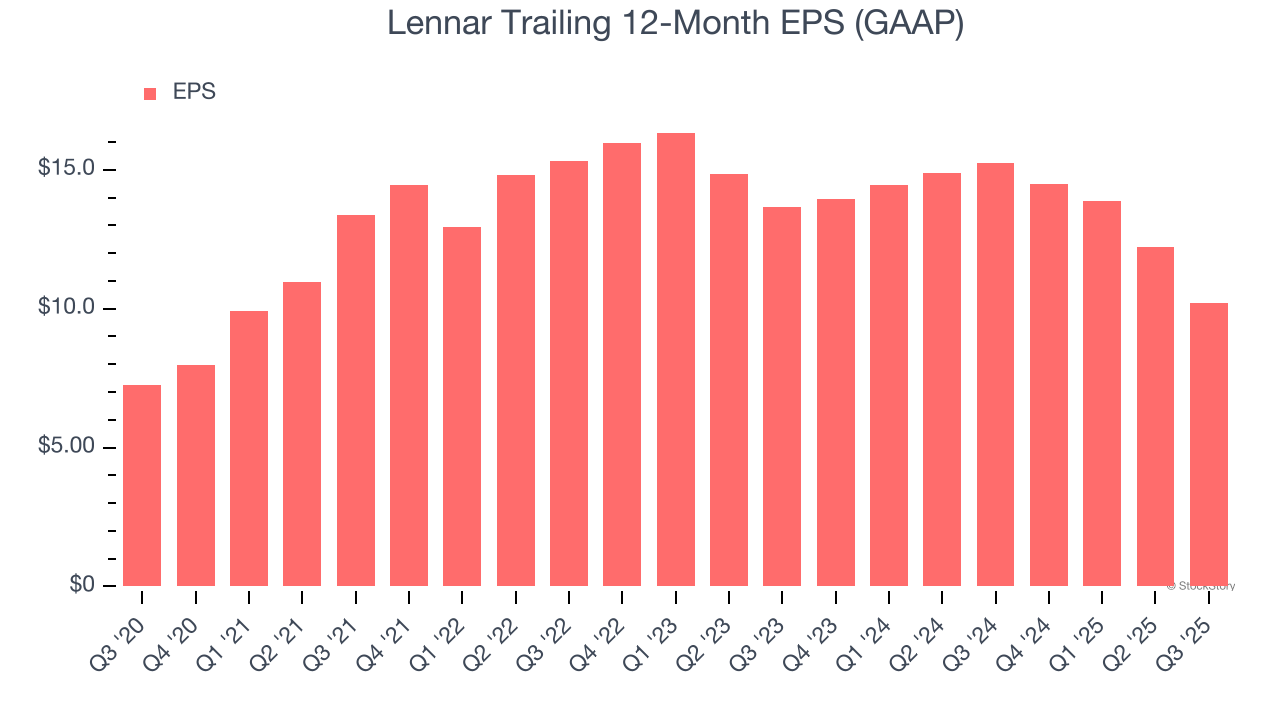
Like with revenue, we analyze EPS over a shorter period to see if we are missing a change in the business.
Lennar’s two-year annual EPS declines of 13.6% were bad and lower than its 2% two-year revenue growth.
Diving into the nuances of Lennar’s earnings can give us a better understanding of its performance. Lennar’s operating margin has declined over the last two years. This was the most relevant factor (aside from the revenue impact) behind its lower earnings; interest expenses and taxes can also affect EPS but don’t tell us as much about a company’s fundamentals.
In Q3, Lennar reported EPS of $2.29, down from $4.30 in the same quarter last year. Despite falling year on year, this print beat analysts’ estimates by 9.2%. Over the next 12 months, Wall Street expects Lennar’s full-year EPS of $10.20 to shrink by 9.6%.
Key Takeaways from Lennar’s Q3 Results
We enjoyed seeing Lennar beat analysts’ backlog expectations this quarter. We were also glad its EPS outperformed Wall Street’s estimates. On the other hand, its revenue missed. Overall, this print had some key positives. The market seemed to be hoping for more, and the stock traded down 3.3% to $128.60 immediately following the results.
So do we think Lennar is an attractive buy at the current price? If you’re making that decision, you should consider the bigger picture of valuation, business qualities, as well as the latest earnings. We cover that in our actionable full research report which you can read here, it’s free.


