It’s testament to the straight-up trajectory of stocks that virtually all signals that told investors to do anything but buy have done them a disservice this year. In fact, when applied to the S&P 500, 15 of 22 chart-based indicators tracked by Bloomberg have actually lost money, back-testing data show. And all are doing worse than a simple buy-and-hold strategy, which is up 11%.
Of course, few investors employ technical studies in isolation, and even when they do, they rarely rely on a single charting technique to inform decisions. But if anything, the exercise is a reminder of the futility of calling a market top in a year when the journey has basically been a one-way trip.
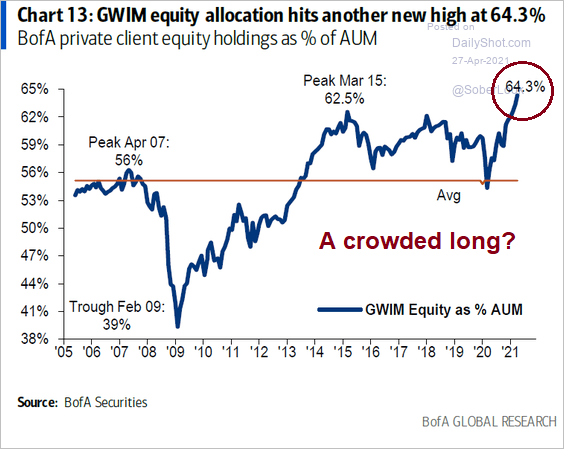
“What we’ve seen this year is a very strong up market that didn’t get many pullbacks,” said Larry Williams, 78, creator of the Williams %R indicator that’s designed to capture a shift in a security’s momentum. A long-short strategy based on the technique is down 7.8% since the end of December.Sell signals have failed. Much of this can be explained. Some, like this sentiment signal from BoA's private client holdings, indicate a record crowded long in equities which is contrarian bearish. However, how much can investors allocate to fixed-income instruments in an era of low and rising rates? Stocks are the only game in town, even for income investors.
The straightforward view is the strength of momentum has overwhelmed all other technical signals.
The full post can be found here.
