I have talked previously about this being a consolidation period under the S&P 500 (SPY) highs of 5,341. But with that seems to also be a rolling correction.
What is that?
Why does it happen?
What can we do about it?
We will tackle all these questions and more in today’s Reitmeister Total Return commentary.
Market Commentary
Since the end of March we see the tale of two markets. On the one hand you have the mega cap dominated S&P 500 plowing ahead to new highs up +2.30% in that stretch.
Now compare that to these other indices:
-2.98% for the Equal Weighted S&P 500 (RSP) which makes NVDA worth the same News Corporation (NWS) which is the smallest firm on the index at only $16 billion market cap. (169.37)
-4.72% for the small caps on the Russell 2000 (2124.55)
What Does This Divergence Mean?
That the market is not as bullish as it seems. This 1 month performance chart by sector also helps to paint this story.
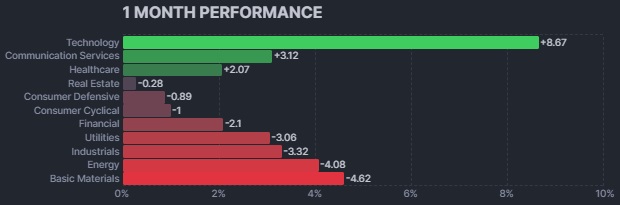
You might be thinking to yourself that technology is a growth Risk On sector. That historically was true. But now it is dominated by the Magnificent 7 which have proven to be a safe haven for investors the past few years when they have a flight to quality.
After technology you see healthcare and consumer defensive not far behind. Those are most certainly Risk Off groups.
Whereas the most Risk On sectors are at the bottom of the chart enduring noticeable losses.
The sum total of this is that the market right now is more Risk Off than one would surmise by a myopic focus on just the S&P 500.
Why is This Happening?
Once again it is the latest round of economic and inflation data which says that economy is too strong...and thus inflationary pressure too high...and thus the longer we will have to wait for the Fed to initiate the first rate cut.
Let’s do a quick roll call of the recent economic data to put this into perspective.
ISM Manufacturing was softer than expected at 48.7...but actually one of the stronger readings of the past year.
ISM Services was well above expectations at 53.8. And with this representing the lion’s share of the economy...then not so good news on the inflation front.
Government Employment Situation had way more jobs added at 272K when the consensus was only 185K. That sounds great until you realize how a hotter job market generally equates to higher wage growth.
Indeed, that came through loud and clear with a 4.1% year over year reading which is a move in the wrong direction after 3.9% last month. Also bothersome was the 0.4% month over month reading when only 0.2% was expected.
There is no doubt the Fed will not like this slate of information leading them to have some more hawkish...or at least “patient” language at the 6/12 Fed announcement on Wednesday afternoon. Along with that will be the quarterly release of the Summary of Economic projections.
Investors will immediately scan to the “dot plot” to see the change in expectations for the pace of rate hikes in the future. Fair to assume that the 3 rate cuts expected in 2024 will be wiped off the board. The greater curiosity is whether that is down to 2 or even just 1 cut in the current year.
This is an outcome that doesn’t mesh with current stock market optimism. But as spelled out in my last commentary and above, I think that S&P 500 optimism is not broadly shared. Just another case of case of investors clinging to the Magnificent 7 with most other stocks groups a couple notches off their highs.
Also noted that bond rates have bounced from recent lows thus implying the odds for a July Fed rate cut is near zero. Plus the probability of a September 18th cut went from 69% likely to 50%.
Sorry to say...but that 50% may be too optimistic. That is why you should set your alarm to watch Powell’s press conference 2:30pm ET on Wednesday June 12th.
This is when the most beneficial stuff is aired with investors reacting in real time. Truly every word...pause...facial expression...is parsed for its hawkish or dovish intent.
My gut sense is that Powell will continue to be more patient than Red Bull laced traders can handle, leading to a pullback from recent highs.
Not anything big enough worth trading in my book because long term still bullish. Just need to take some of the froth out of all stocks including the Mega Caps.
To be clear, it is possible that the recent cuts from Canada and Europe could make the Fed more dovish than the public data would suggest. And yes, that would coincide with a broad rally where more Risk On groups would lead the charge.
Adding it all up, we are at any interesting cross roads. Not bullish vs. bearish. But rather Risk On vs. Risk Off until we have greater certainty of when the catalyst of the first Fed rate cut will be served up.
This says to stay invested in the best stocks. You know what I am going to say next...those are the A & B ranked stocks according to our POWR Ratings.
My hand picked favorites are discussed in the next section...
What To Do Next?
Discover my current portfolio of 11 stocks packed to the brim with the outperforming benefits found in our exclusive POWR Ratings model. (Nearly 4X better than the S&P 500 going back to 1999)
Plus 2 specialty ETFs that are benefiting from some of the hottest investment trends.
These hand selected picks are all based on my 44 years of investing experience seeing bull markets...bear markets...and everything between.
If you are curious to learn more, and want to see these lucky 13 trades, then please click the link below to get started now.
Steve Reitmeister’s Trading Plan & Top Picks >
Wishing you a world of investment success!

Steve Reitmeister…but everyone calls me Reity (pronounced “Righty”)
CEO, StockNews.com and Editor, Reitmeister Total Return
SPY shares fell $0.07 (-0.01%) in after-hours trading Tuesday. Year-to-date, SPY has gained 13.32%, versus a % rise in the benchmark S&P 500 index during the same period.
About the Author: Steve Reitmeister

Steve is better known to the StockNews audience as “Reity”. Not only is he the CEO of the firm, but he also shares his 40 years of investment experience in the Reitmeister Total Return portfolio. Learn more about Reity’s background, along with links to his most recent articles and stock picks.
The post Bullish or Bearish Stock Set Up? appeared first on StockNews.com