
Life sciences company Neogen (NASDAQ: NEOG) reported Q4 CY2025 results beating Wall Street’s revenue expectations, but sales fell by 2.8% year on year to $224.7 million. The company’s full-year revenue guidance of $850 million at the midpoint came in 3% above analysts’ estimates. Its non-GAAP profit of $0.10 per share was 50% above analysts’ consensus estimates.
Is now the time to buy Neogen? Find out by accessing our full research report, it’s free for active Edge members.
Neogen (NEOG) Q4 CY2025 Highlights:
- Revenue: $224.7 million vs analyst estimates of $209.7 million (2.8% year-on-year decline, 7.2% beat)
- Adjusted EPS: $0.10 vs analyst estimates of $0.07 (50% beat)
- Adjusted EBITDA: $48.75 million vs analyst estimates of $39.17 million (21.7% margin, 24.5% beat)
- The company lifted its revenue guidance for the full year to $850 million at the midpoint from $830 million, a 2.4% increase
- EBITDA guidance for the full year is $175 million at the midpoint, above analyst estimates of $165.8 million
- Operating Margin: -2.4%, up from -198% in the same quarter last year
- Free Cash Flow Margin: 3.5%, down from 10% in the same quarter last year
- Market Capitalization: $1.60 billion
Company Overview
Founded in 1981 and operating at the intersection of food safety and animal health, Neogen (NASDAQ: NEOG) develops and manufactures diagnostic tests and related products to detect dangerous substances in food and pharmaceuticals for animal health.
Revenue Growth
Examining a company’s long-term performance can provide clues about its quality. Even a bad business can shine for one or two quarters, but a top-tier one grows for years. Luckily, Neogen’s sales grew at a solid 15.2% compounded annual growth rate over the last five years. Its growth beat the average healthcare company and shows its offerings resonate with customers.
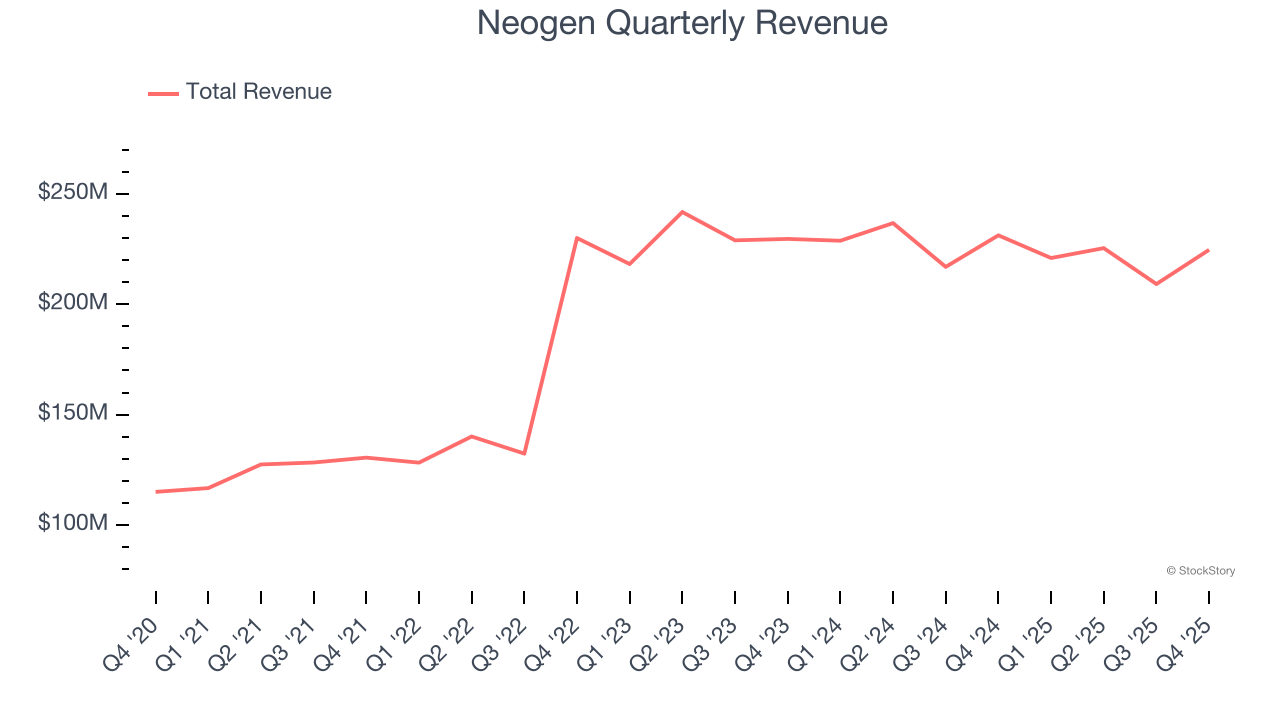
Long-term growth is the most important, but within healthcare, a half-decade historical view may miss new innovations or demand cycles. Neogen’s recent performance marks a sharp pivot from its five-year trend as its revenue has shown annualized declines of 2.1% over the last two years. 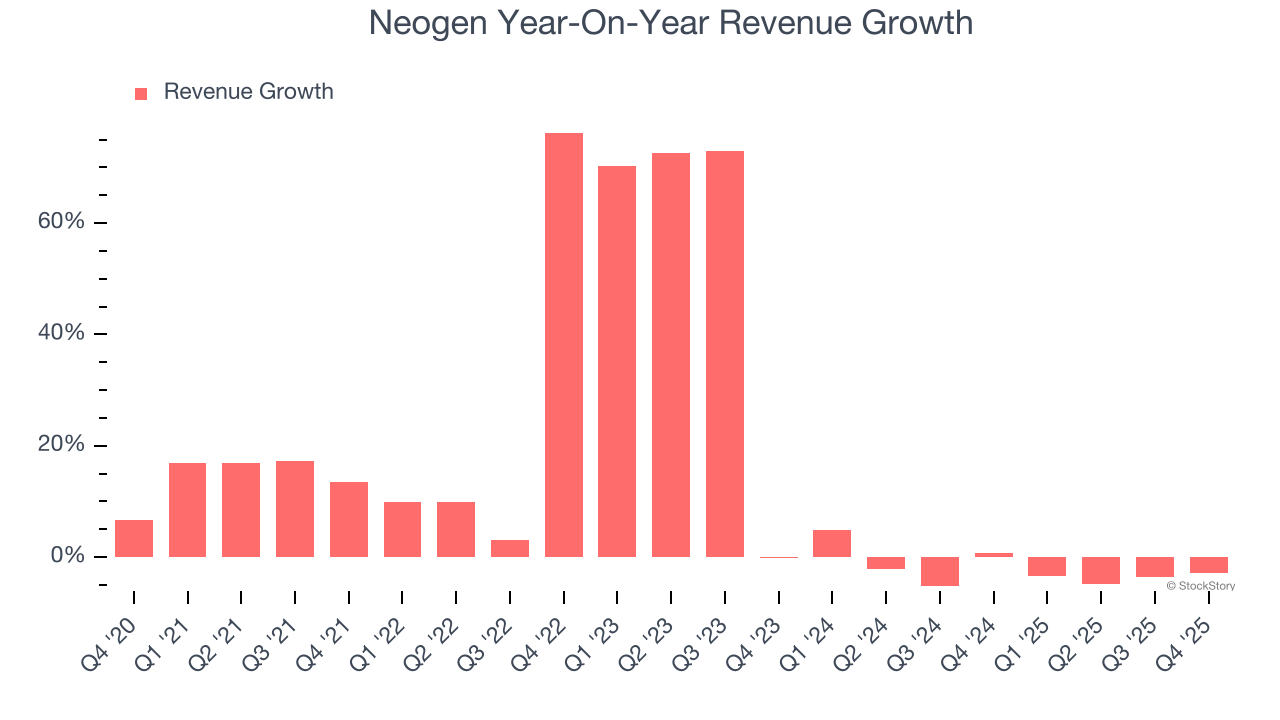
This quarter, Neogen’s revenue fell by 2.8% year on year to $224.7 million but beat Wall Street’s estimates by 7.2%.
Looking ahead, sell-side analysts expect revenue to decline by 5.3% over the next 12 months, a deceleration versus the last two years. This projection is underwhelming and suggests its products and services will see some demand headwinds.
Microsoft, Alphabet, Coca-Cola, Monster Beverage—all began as under-the-radar growth stories riding a massive trend. We’ve identified the next one: a profitable AI semiconductor play Wall Street is still overlooking. Go here for access to our full report.
Operating Margin
Operating margin is a key measure of profitability. Think of it as net income - the bottom line - excluding the impact of taxes and interest on debt, which are less connected to business fundamentals.
Neogen’s high expenses have contributed to an average operating margin of negative 23.2% over the last five years. Unprofitable healthcare companies require extra attention because they could get caught swimming naked when the tide goes out. It’s hard to trust that the business can endure a full cycle.
Looking at the trend in its profitability, Neogen’s operating margin decreased by 85.2 percentage points over the last five years. The company’s two-year trajectory also shows it failed to get its profitability back to the peak as its margin fell by 79.2 percentage points. This performance was poor no matter how you look at it - it shows its expenses were rising and it couldn’t pass those costs onto its customers.
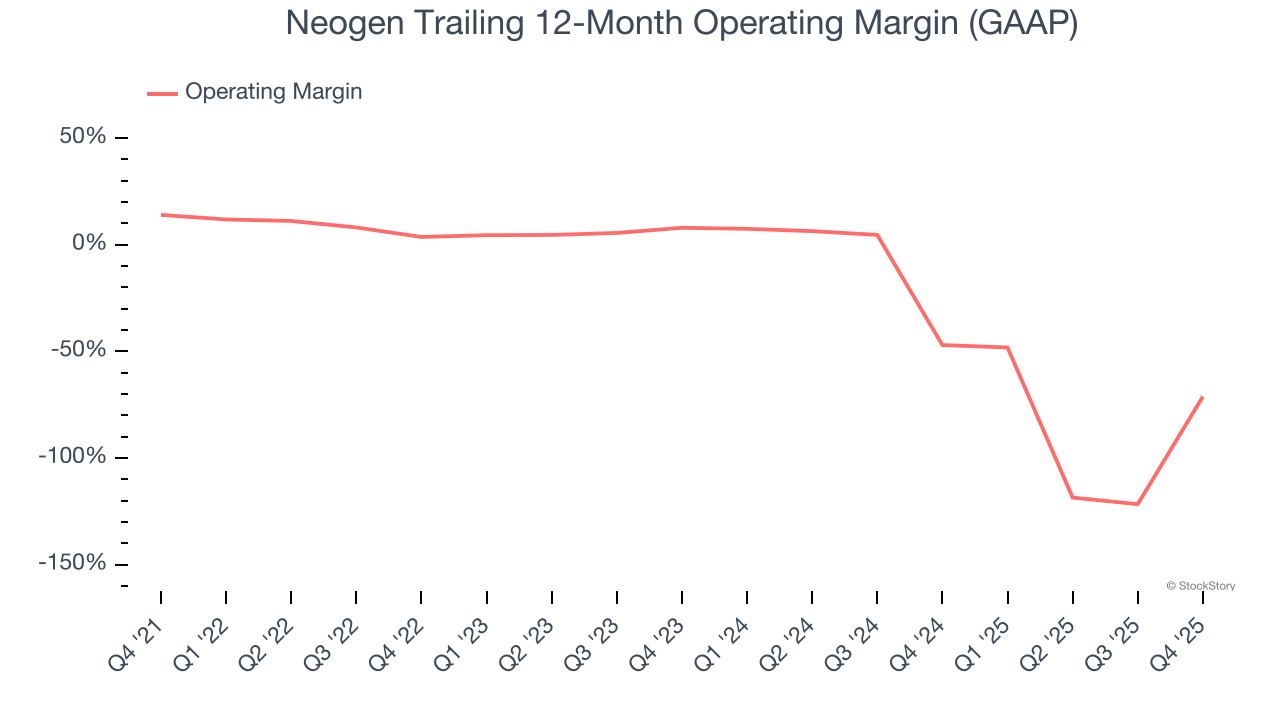
Neogen’s operating margin was negative 2.4% this quarter.
Earnings Per Share
Revenue trends explain a company’s historical growth, but the long-term change in earnings per share (EPS) points to the profitability of that growth – for example, a company could inflate its sales through excessive spending on advertising and promotions.
Sadly for Neogen, its EPS declined by 12.6% annually over the last five years while its revenue grew by 15.2%. This tells us the company became less profitable on a per-share basis as it expanded.
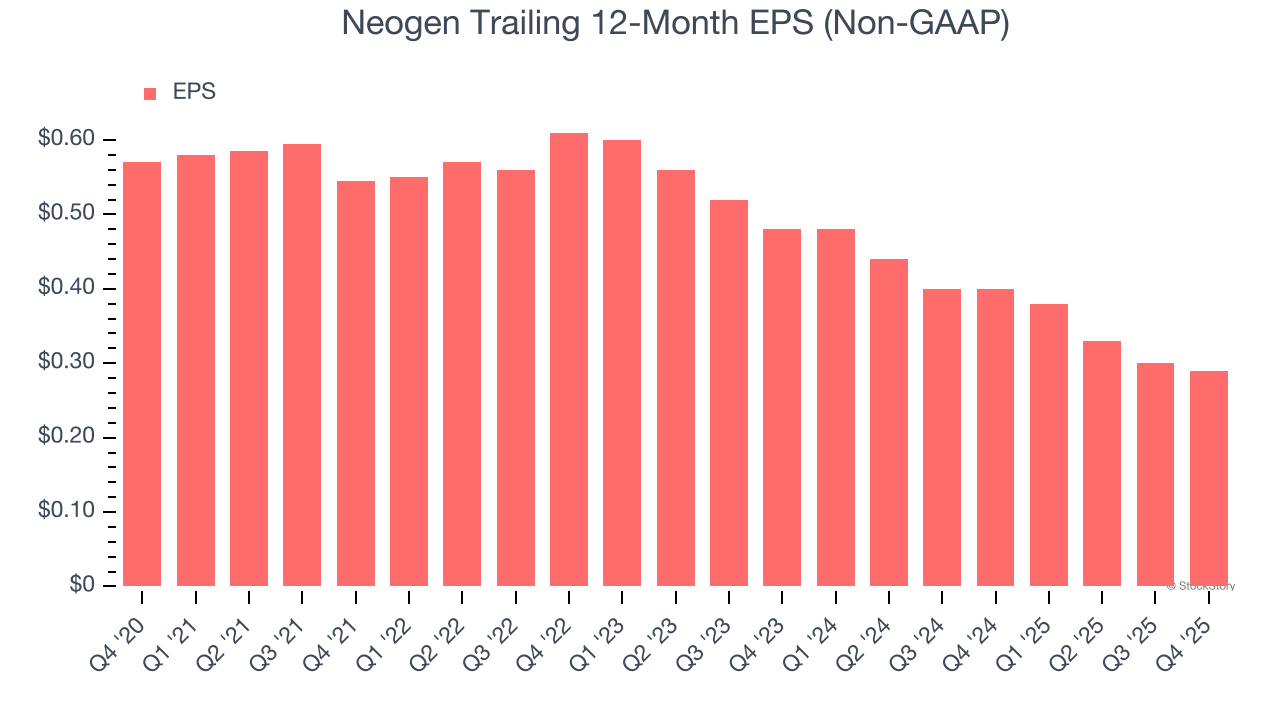
We can take a deeper look into Neogen’s earnings to better understand the drivers of its performance. As we mentioned earlier, Neogen’s operating margin expanded this quarter but declined by 85.2 percentage points over the last five years. Its share count also grew by 104%, meaning the company not only became less efficient with its operating expenses but also diluted its shareholders. 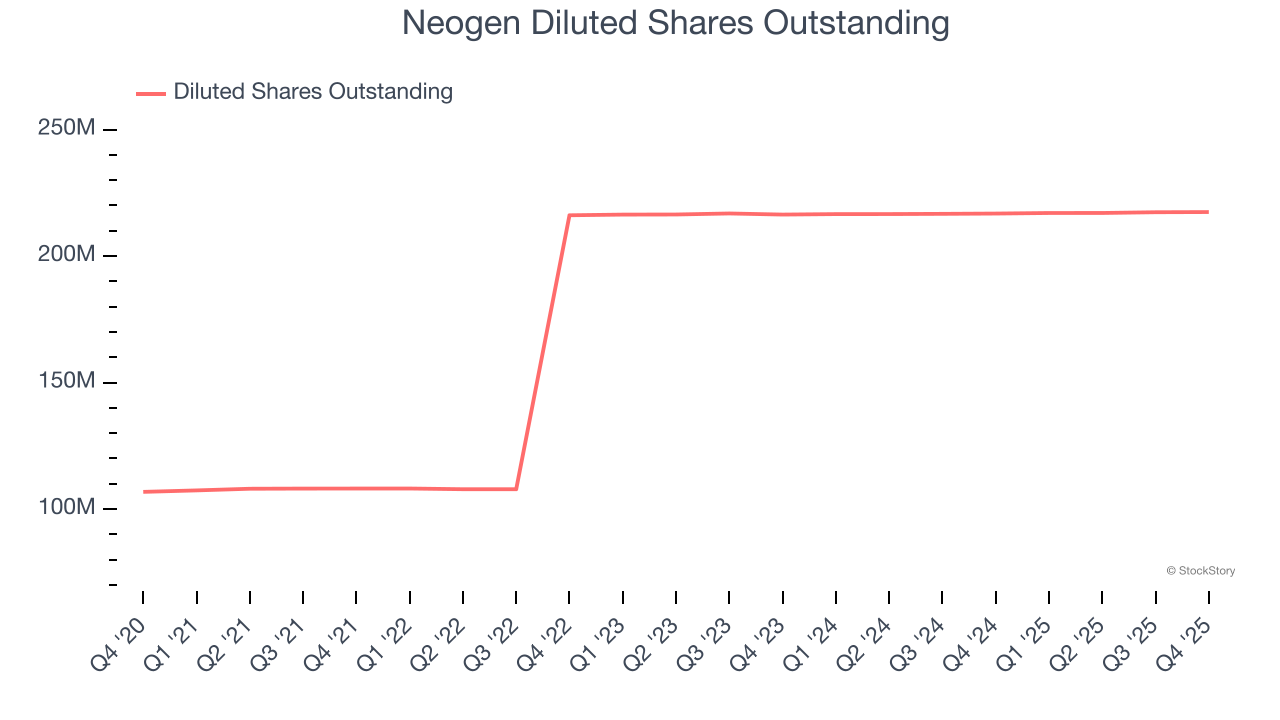
In Q4, Neogen reported adjusted EPS of $0.10, down from $0.11 in the same quarter last year. Despite falling year on year, this print easily cleared analysts’ estimates. Over the next 12 months, Wall Street expects Neogen’s full-year EPS of $0.29 to grow 34.5%.
Key Takeaways from Neogen’s Q4 Results
This was a convincing 'beat and raise' quarter. It was good to see Neogen beat analysts’ revenue and EPS expectations handily this quarter. We were also excited its revenue guidance was raised and now exceed Wall Street’s estimates. Zooming out, we think this quarter featured many important positives and was very impressive. The stock traded up 19.8% to $8.84 immediately after reporting.
Sure, Neogen had a solid quarter, but if we look at the bigger picture, is this stock a buy? What happened in the latest quarter matters, but not as much as longer-term business quality and valuation, when deciding whether to invest in this stock. We cover that in our actionable full research report which you can read here, it’s free for active Edge members.


