Hydraulic fracturing services company Liberty Energy (NYSE: LBRT) reported Q3 2026 results beating Wall Street’s revenue expectations, with sales up 26.3% year on year to $1.20 billion. Its non-GAAP profit of $0.06 per share was $0.01 below analysts’ consensus estimates.
Is now the time to buy Liberty Energy? Find out by accessing our full research report, it’s free.
Liberty Energy (LBRT) Q3 2026 highlights:
- Revenue: $1.20 billion vs analyst estimates of $1.18 billion (26.3% year-on-year growth, 1.6% beat)
- Adjusted EPS: $0.06 vs analyst estimates of $0.07 ($0.01 miss)
- Adjusted EBITDA: $141.6 million vs analyst estimates of $148.8 million (11.8% margin, 4.8% miss)
- Operating Margin: 1.6%, up from -0.3% in the same quarter last year
- Market Capitalization: $2.71 billion
“Liberty's completions trajectory has improved meaningfully from early year cyclical lows. Strong customer engagement and strengthening market fundamentals provide a more constructive outlook as we close out the year. Third quarter revenue of $1.2 billion and Adjusted EBITDA of $142 million reflected strong operational execution and modest price increases, partially offset by drilling-related delays and cost inflation headwinds,” commented Ron Gusek, Chief Executive Officer. “During the quarter, we delivered significantly lower fuel costs for our customers. Record natural gas substitution of over 60% of the total fuel consumed by our fleets provided annualized fuel savings of over $1 billion for our customers. This achievement reflects continued investment in natural gas fueled equipment and a concerted focus on the digital intelligence layer that drives meaningful operational optimization of equipment and widens the performance gap amongst industry frac fleets.”
Company overview
Operating approximately 40 active fleets across North America's most productive shale basins, Liberty Energy (NYSE: LBRT) provides hydraulic fracturing services that help oil and gas companies extract resources from shale formations.
Revenue growth
Cyclical sectors like Energy often flatter weaker operators during favorable price environments, but a longer-term lens separates those from businesses that can consistently perform across market cycles. Over the last five years, Liberty Energy grew its sales at an impressive 16.8% compounded annual growth rate. Its growth beat the average energy upstream and integrated energy company and shows its offerings resonate with customers.
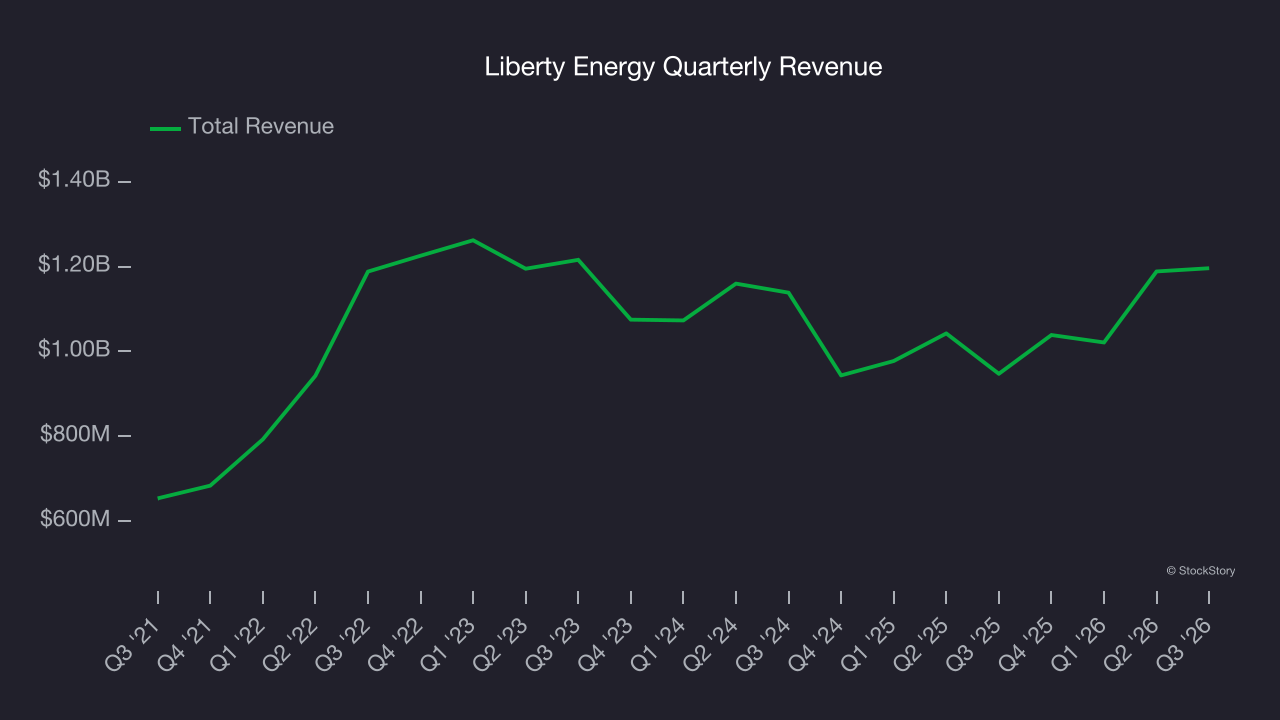
Within Energy, a singular timeframe, even if it’s quite long-term, only sheds light on how well a company rode the last commodity cycle. To better assess whether a company compounds through cycles, we validate our view with an even longer, ten-year view. Liberty Energy’s annualized revenue growth of 30.1% over the last ten years is above its five-year trend.
This quarter, Liberty Energy reported robust year-on-year revenue growth of 26.3%, and its $1.20 billion of revenue topped Wall Street estimates by 1.6%.
ONE MORE THING: The $21 AI Application Stock Wall Street Forgot. While Wall Street obsesses over who’s building AI, one company is already using it to print money. And nobody’s paying attention.
AI chip stocks trade at ridiculous valuations. This company processes a trillion consumer signals monthly using AI and trades at a third of the price. The gap won’t last. The institutions will figure it out. You need to see this first. Read the FREE Report Before They Notice.
Adjusted EBITDA margin
Adjusted EBITDA margin is an important measure of profitability for the sector and accounts for the gross margins and operating costs mentioned previously. Unlike operating margin, it is not distorted by accounting conventions around reserves, drilling costs, and assumptions on commodity consumption from the well or basin. Adjusted EBITDA highlights the economic reality of how much cash the rock produces before the capital structure (debt service) and the drilling budget (capex) are considered.
Liberty Energy was profitable over the last five years but held back by its large cost base. Its average EBITDA margin of 19.1% was weak for an upstream and integrated energy business.
Looking at the trend in its profitability, Liberty Energy’s EBITDA margin decreased by 3.3 percentage points over the last year. This raises questions about the company’s expense base because its revenue growth should have given it leverage on its fixed costs, resulting in better economies of scale and profitability. Liberty Energy’s performance was poor no matter how you look at it - it shows that costs were rising and it couldn’t pass them onto its customers.
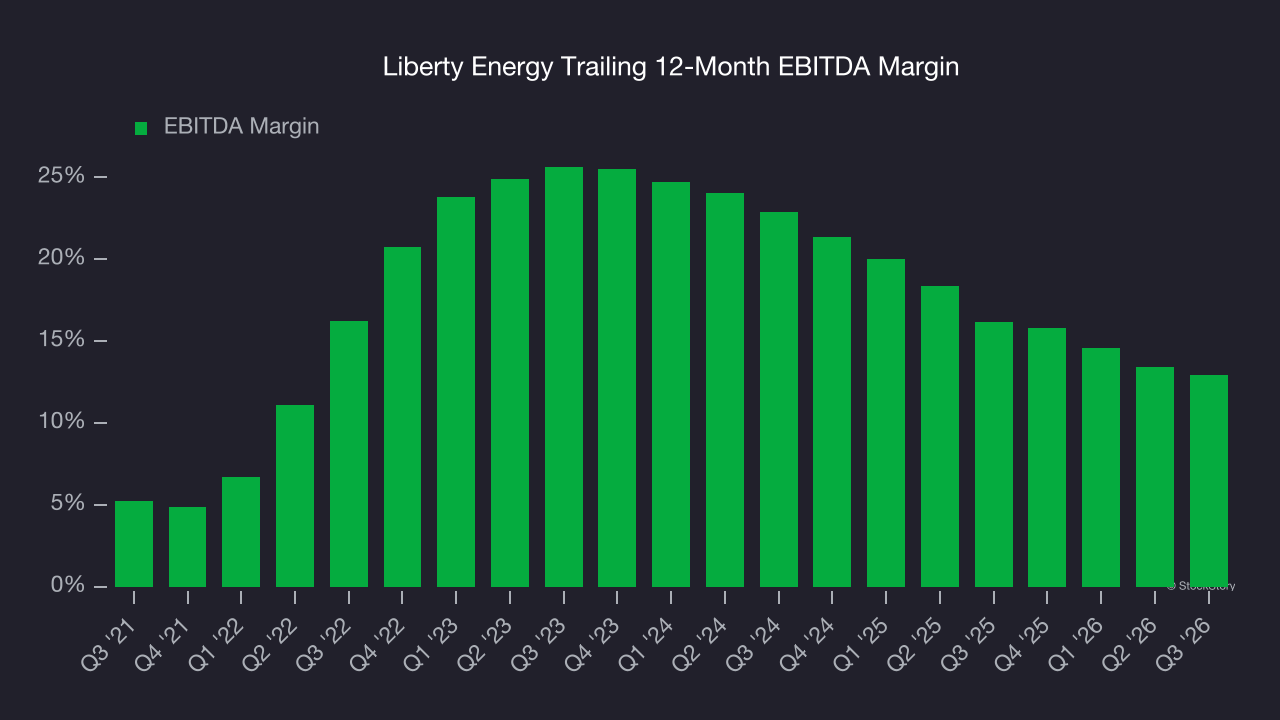
This quarter, Liberty Energy generated an EBITDA margin profit margin of 11.8%, down 1.6 percentage points year on year. This reduction is quite minuscule and indicates the company’s overall cost structure has been relatively stable. This adjusted EBITDA fell short of Wall Street’s estimates.
Cash is king
Adjusted EBITDA shows how profitable a company’s existing “rock” is before financing and reinvestment, while free cash flow shows how much value remains after paying to replace those wells. Because production declines over time, strong EBITDA can coexist with weak FCF if drilling is expensive or declines are steep. FCF therefore captures both operating efficiency and the cost of sustaining production.
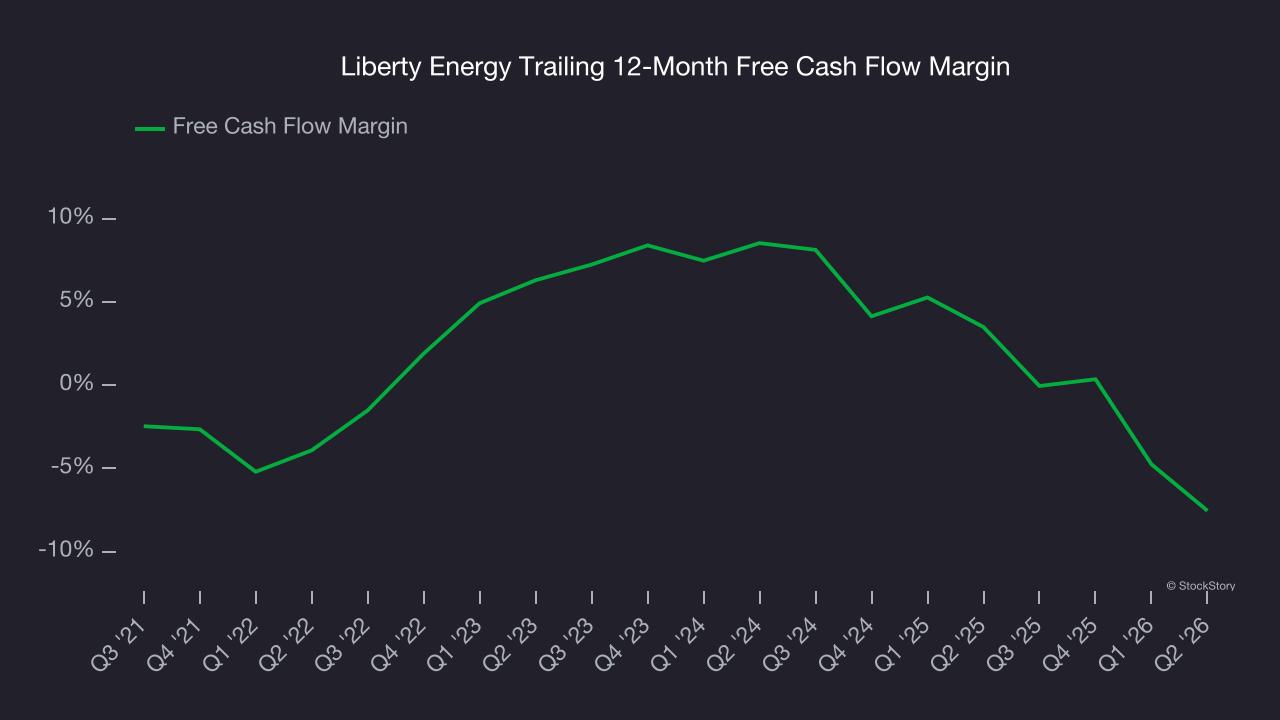
Liberty Energy has shown weak cash profitability relative to peers over the last five years, giving the company fewer opportunities to return capital to shareholders. Its free cash flow margin averaged 2%, below what we’d expect for an upstream and integrated energy business.
While the level of free cash flow margins is important, their consistency matters just as much.
Liberty Energy’s ratio of quarterly free cash flow volatility to WTI crude price volatility over the past five years was 25.2 (lower is better), indicating that its cash generation is far more sensitive to commodity-price swings than most peers. This elevated volatility limits its access to capital in downturns and makes it unlikely to act as a consolidator when weaker competitors come under pressure.
You may be asking why we wait until the free cash flow line to perform this stability analysis versus commodity prices. Why not compare revenue or EBITDA to WTI Crude prices in the case of Liberty Energy? Because what ultimately matters is not how much revenue or profit you earn when prices are high but how much cash you can generate when prices are low. Free cash flow is the superior metric because it includes everything from hedging prowess to growth and maintenance capex to management behavior during good times and bad.
Key takeaways from Liberty Energy’s Q3 results
It was encouraging to see Liberty Energy beat analysts’ revenue expectations this quarter. On the other hand, its EPS was in line and its EBITDA fell short of Wall Street’s estimates. Overall, this was a weaker quarter. The stock traded up 6.7% to $18.12 immediately after reporting.
Is Liberty Energy an attractive investment opportunity right now? If you’re making that decision, you should consider the bigger picture of valuation, business qualities, as well as the latest earnings. We cover that in our actionable full research report which you can read here (it’s free).