Data center products and services company Vertiv (NYSE: VRT) reported Q3 2026 results beating Wall Street’s revenue expectations, with revenue up 61.2% year on year to $4.31 billion. Revenue guidance for next quarter was $4.41 billion at the midpoint, 2.1% above analysts’ consensus estimates. Its non-GAAP profit of $2.21 per share was 21.2% above analysts’ consensus estimates.
For more on Vertiv, read our free full research report.
Vertiv (VRT) Q3 2026 highlights:
- Revenue $4.31 billion vs S&P analysts’ consensus estimates of $3.77 billion (61.2% year-on-year growth, 14.5% beat)
- Adjusted EPS $2.21 vs S&P analysts’ consensus estimates of $1.82 (21.2% beat)
- Revenue guidance $4.41 billion at the midpoint for Q4 2026, above analysts’ consensus estimates of $4.32 billion
- Adjusted EPS guidance Management raised its full-year adjusted EPS guidance to $7.15 at the midpoint, a 6.7% increase
- Operating margin 22.8%, up from 19.3% in the same quarter last year
- Free cash flow margin 15.1%, down from 17.3% in the same quarter last year
- Organic revenue rose 55% year on year (beat)
- Market capitalization $80.29 billion
"We are in the middle of the largest infrastructure buildout and it's accelerating," said Giordano Albertazzi, Vertiv's Chief Executive Officer. "The demands on data center infrastructure are evolving faster than ever, and Vertiv's role in that buildout keeps expanding. We're compressing new product development cycles from years to months. We're industrializing converged infrastructure at a scale that didn't exist before and strengthening competencies that are very hard to replicate. We are expanding capacity, improving productivity, and executing with rigor. The infrastructure we deliver performs at the highest levels of reliability. Customers are choosing Vertiv as the partner that can engineer, deliver, scale and service across the entire lifecycle. Our more than 100% organic orders growth year over year and our overall performance are clear testaments to that."
Revenue growth
A company’s long-term revenue performance is one signal of its overall quality. Even a poor business can perform well for one or two quarters, but a top-tier one grows for years. Over the last five years, Vertiv grew its revenue at a 21.8% compounded annual growth rate. Its growth surpassed the average industrials company and shows its offerings resonate with customers.
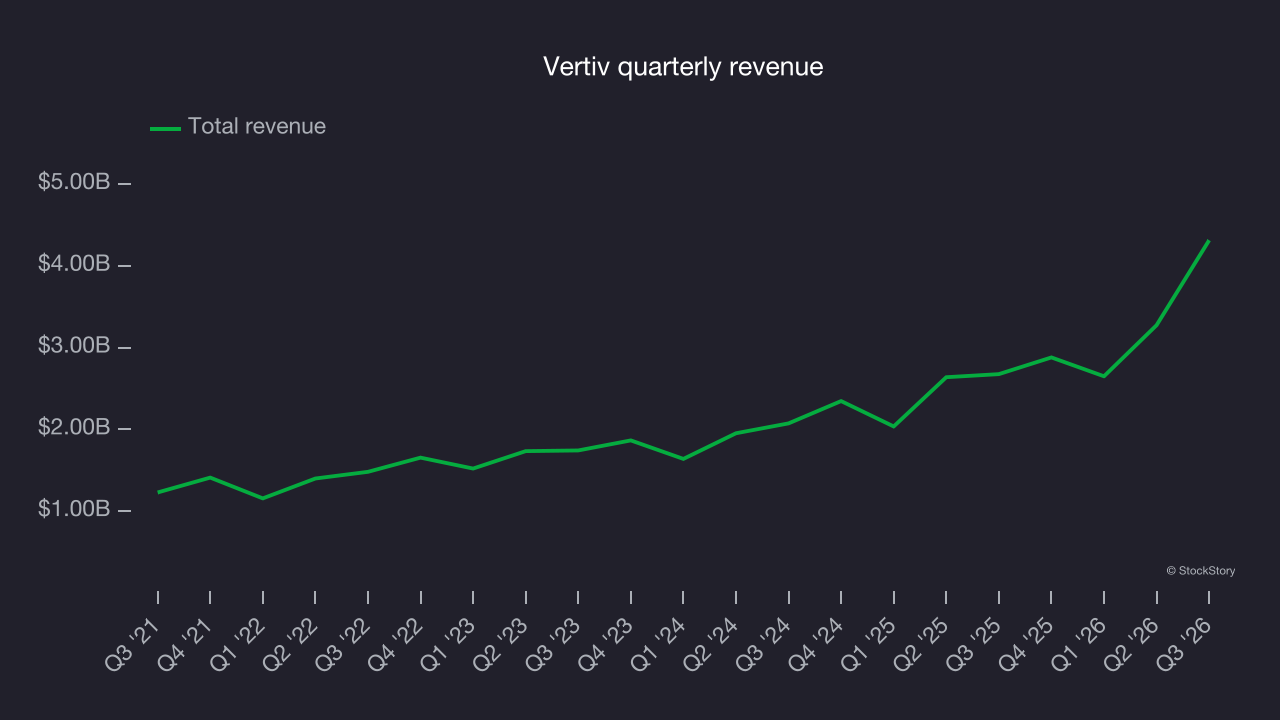
Long-term growth is the most important, but within industrials, a half-decade historical view may miss new industry trends or demand cycles. Vertiv’s annualized revenue growth of 32% over the last two years is above its five-year trend, suggesting its demand was strong and recently accelerated. 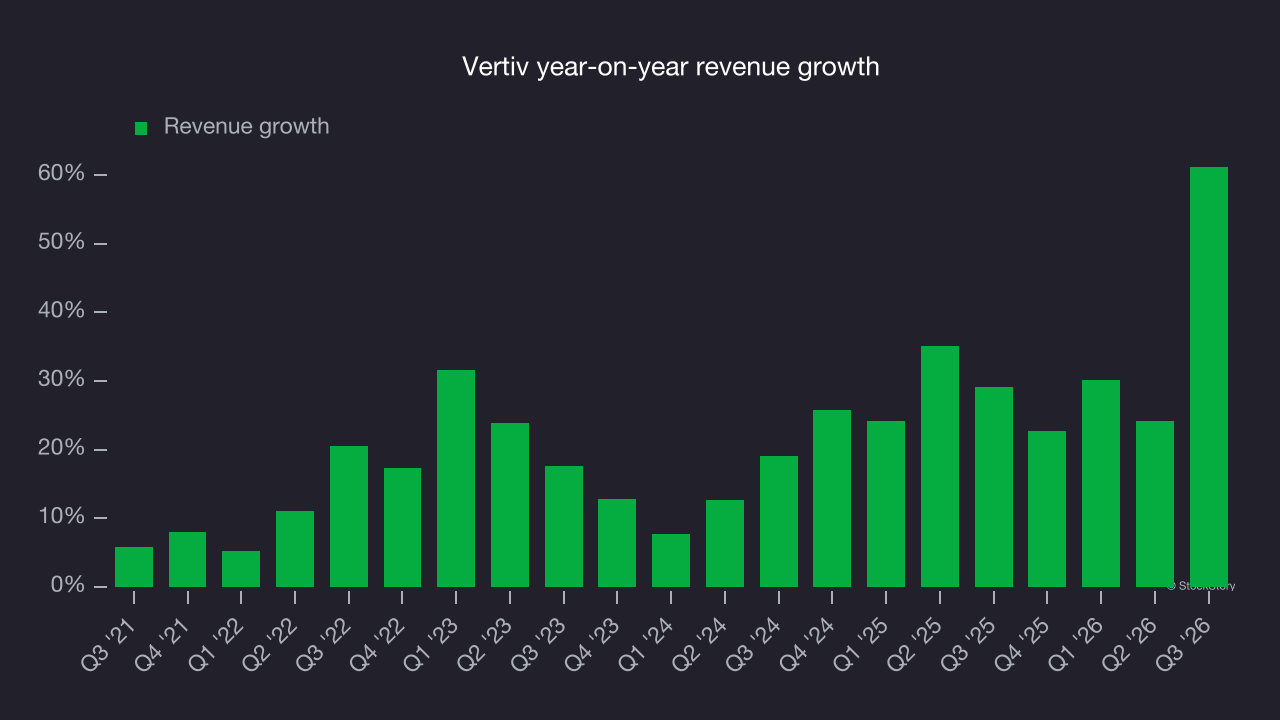
Vertiv also reports organic revenue, which strips out one-time events like acquisitions and currency fluctuations that don’t accurately reflect its fundamentals. Over the last two years, Vertiv’s organic revenue averaged 28.7% year-on-year growth. Total revenue growth outpaced organic growth over that period, indicating that a combination of acquisitions and foreign exchange rates boosted its headline results. 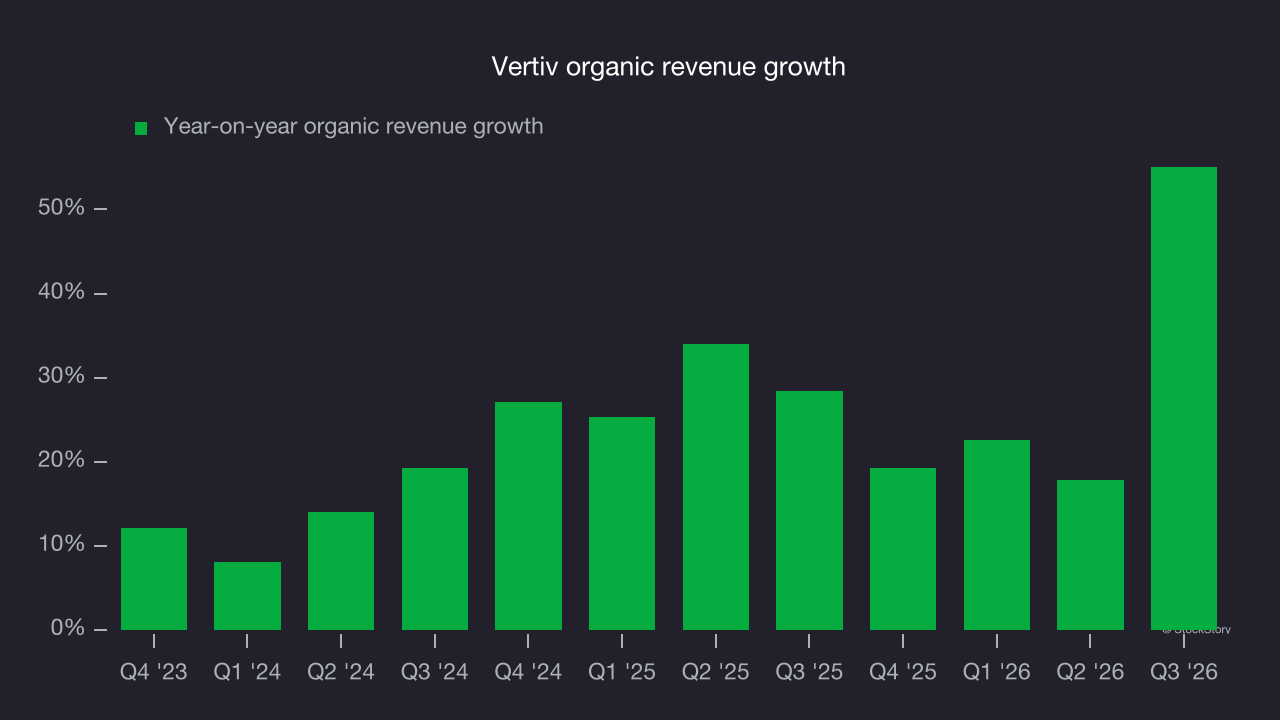
This quarter, Vertiv reported year-on-year revenue growth of 61.2%, and its revenue of $4.31 billion beat Wall Street’s consensus estimates by 14.5%. Management is currently guiding for a 53.2% year-on-year increase in revenue next quarter.
Looking further ahead, sell-side analysts expect revenue to grow 31.3% over the next 12 months, according to S&P, similar to its two-year rate. This is a strong growth forecast for a company of its scale and suggests the market sees success for its products and services.
Operating margin
Operating margin is an important measure of profitability as it shows the portion of revenue left after accounting for all core expenses, from the cost of goods sold to advertising and wages. It’s also useful for comparing profitability across companies with different levels of debt and tax rates because it excludes interest and taxes.
Vertiv has been an efficient company over the last five years. It was one of the more profitable businesses in the industrials sector, with an average operating margin of 15%. That outcome is unsurprising given its favorable gross margin baseline.
Looking at the trend in its profitability, Vertiv’s operating margin rose by 19.1 percentage points over the last five years, as its revenue growth provided substantial operating leverage.
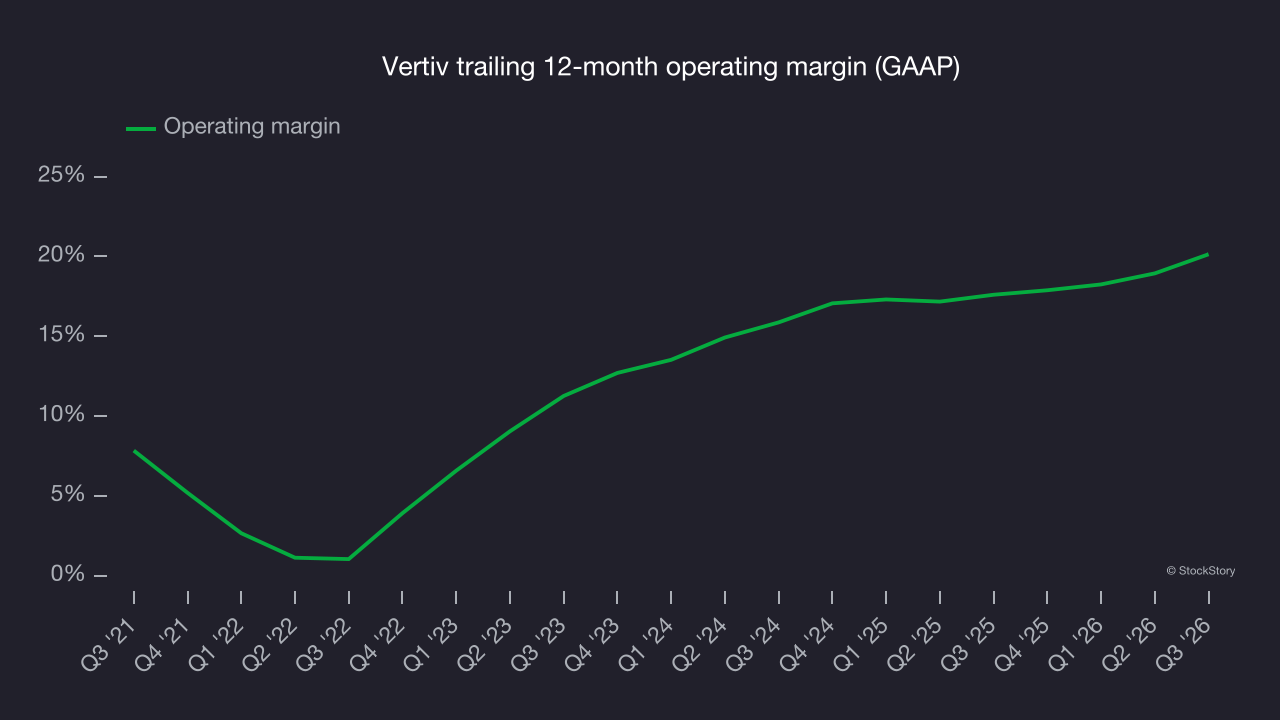
In Q3, Vertiv generated an operating margin of 22.8%, up 3.5 percentage points year on year. The increase was a positive sign, and operating margin outpaced gross margin, indicating greater efficiency in expenses such as marketing, R&D and administrative overhead.
Earnings per share
Revenue trends explain a company’s historical growth, but the long-term change in earnings per share (EPS) points to the profitability of that growth. For example, a company could inflate its revenue through excessive spending on advertising and promotions.
Vertiv’s EPS grew at a 42.9% compounded annual growth rate over the last five years, higher than its 21.8% annualized revenue growth. This tells us the company became more profitable on a per-share basis as it expanded.
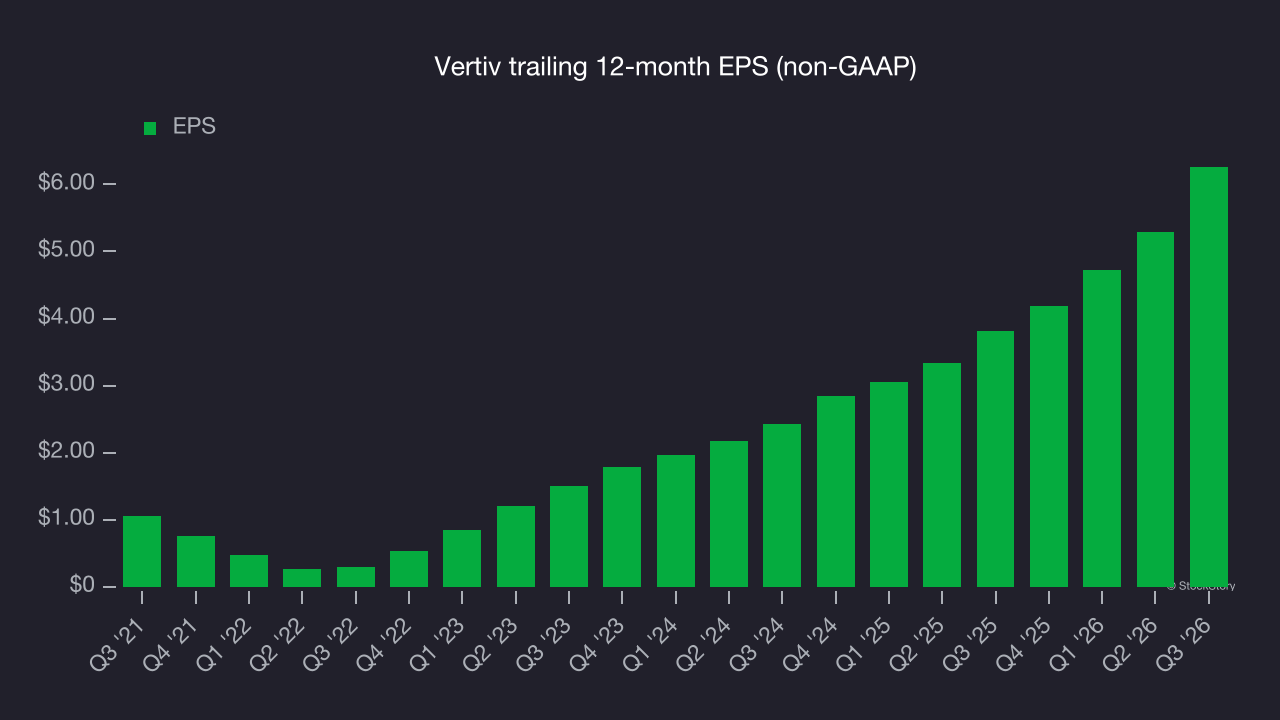
Diving into the nuances of Vertiv’s earnings can give us a better understanding of its performance. As we mentioned earlier, Vertiv’s operating margin expanded by 19.1 percentage points over the last five years. This was the most relevant factor (aside from the revenue impact) behind its higher earnings; interest expenses and taxes can also affect EPS but don’t tell us as much about a company’s fundamentals.
Like with revenue, we analyze EPS over a more recent period because it can provide insight into an emerging theme or development for the business.
For Vertiv, its two-year annual EPS growth of 60.8% was higher than its five-year trend. That acceleration is a positive sign, especially given the already high base.
In Q3, Vertiv reported adjusted EPS of $2.21, up from $1.24 in the same quarter last year. The result easily cleared analysts’ consensus estimates, a positive outcome for shareholders. Over the next 12 months, Wall Street expects Vertiv’s full-year EPS to grow 38.2% from $6.26 to $8.65, according to S&P.
Key takeaways from Vertiv’s Q3 results
Vertiv delivered a strong Q3, with organic revenue well above analysts’ consensus expectations and revenue beating Wall Street’s consensus estimates by a wide margin. Shares soared 15.2% to $240.51 immediately after the results.
Vertiv reported solid earnings, but one quarter doesn’t necessarily make the stock a buy. When making that decision, consider the bigger picture of valuation and business quality, as well as the latest earnings. Read our full research report here (it’s free).