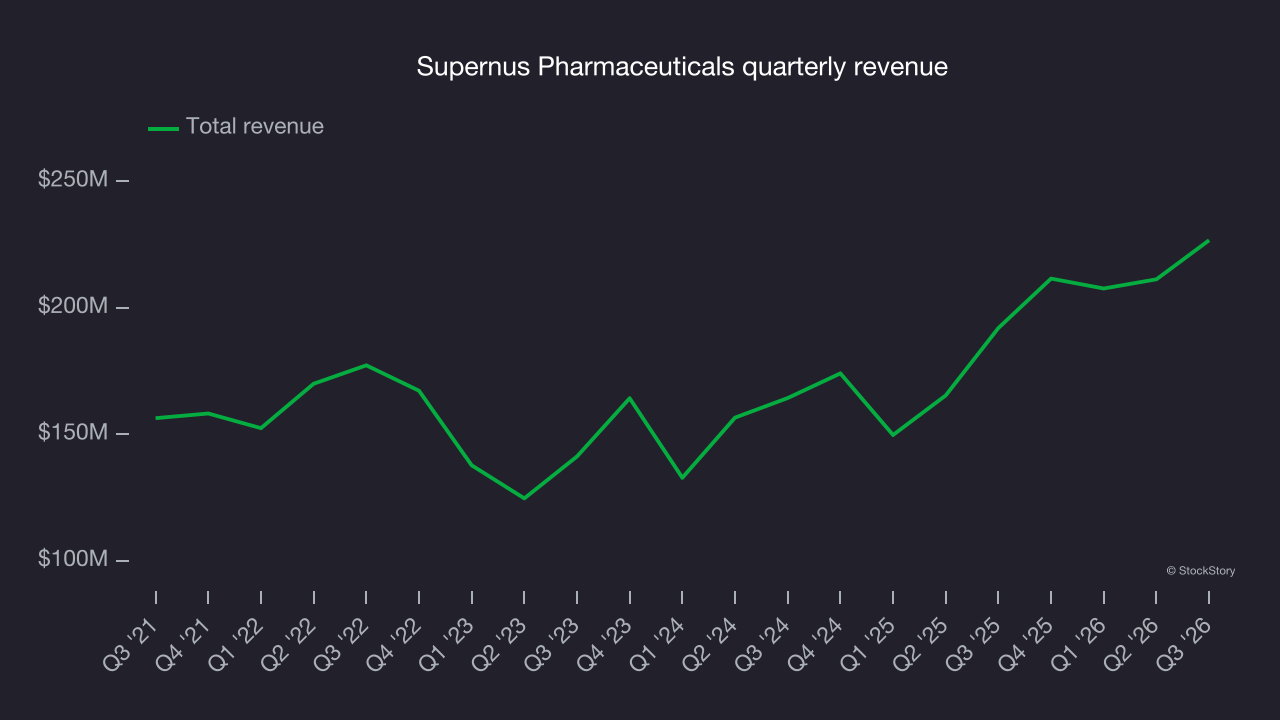
Specialty pharmaceutical company Supernus Pharmaceuticals (NASDAQ: SUPN) beat Wall Street’s revenue expectations in Q3 2026, with revenue rising 18.1% year on year to $226.8 million. The company’s full-year revenue guidance of $887.5 million at the midpoint came in 1.5% above analysts’ consensus estimates. Its GAAP profit of $0.35 per share was significantly above analysts’ consensus estimates.
For more on Supernus Pharmaceuticals, read our free full research report.
Supernus Pharmaceuticals (SUPN) Q3 2026 highlights:
- Revenue $226.8 million vs S&P analysts’ consensus estimates of $218.4 million (18.1% year-on-year growth, 3.8% beat)
- EPS (GAAP) $0.35 vs analysts’ consensus estimates of -$0.08 (significant beat)
- Revenue guidance The company lifted its revenue guidance for the full year to $887.5 million at the midpoint from $875 million, a 1.4% increase
- Operating margin 9.3%, up from -31.4% in the same quarter last year
- Market capitalization $2.39 billion
“Our strong operating execution year-to-date delivered total revenue growth of 29%, which shows the continued momentum across our commercial portfolio, specifically our growth products.” said Jack Khattar, President and Chief Executive Officer of Supernus. “We look forward to closing the merger with Indivior next week, which will create a diverse CNS biopharmaceutical leader positioned to serve more patients and deliver long-term value for shareholders.”
Revenue growth
A company’s long-term revenue performance is one signal of its overall quality. Any business can deliver a good quarter or two, but the best consistently grow over the long haul. Over the last five years, Supernus Pharmaceuticals grew its revenue at a decent 7.6% compounded annual growth rate. Its growth was slightly above the average healthcare company and shows its offerings resonate with customers.
Long-term growth is the most important, but within healthcare, a half-decade historical view may miss new innovations or demand cycles. Supernus Pharmaceuticals’s annualized revenue growth of 17.8% over the last two years is above its five-year trend, suggesting its demand recently accelerated. 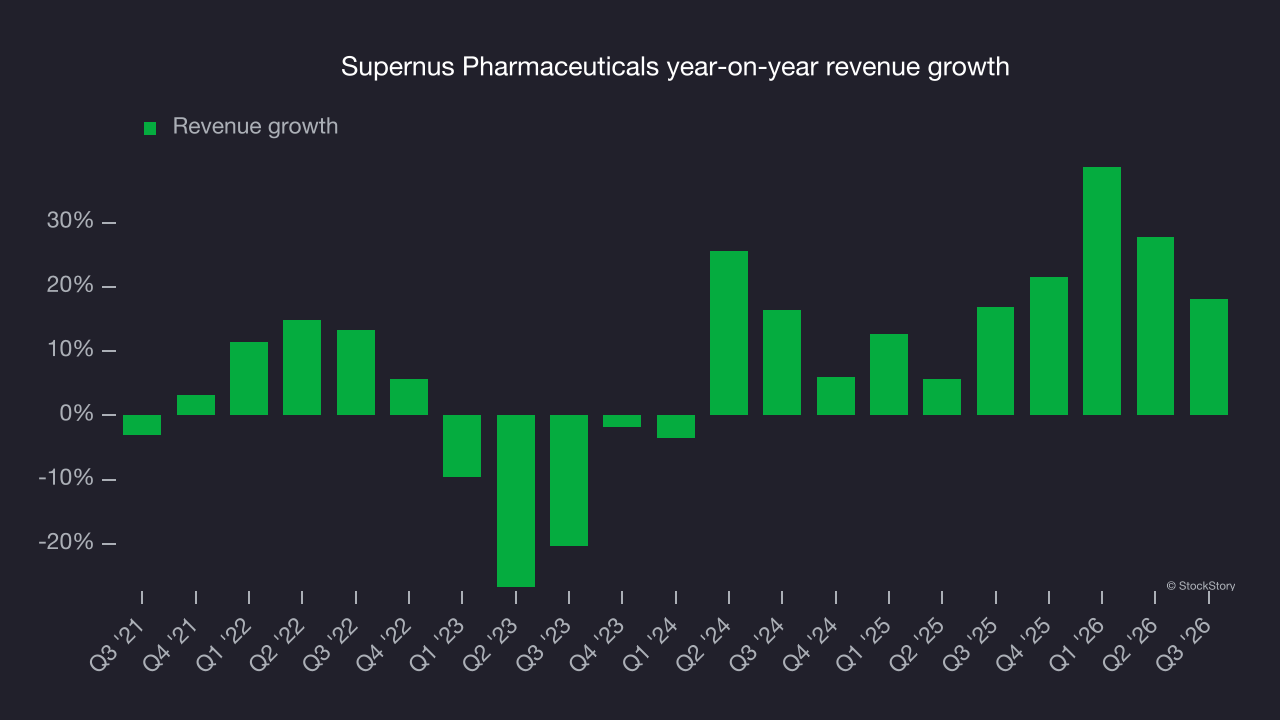
This quarter, Supernus Pharmaceuticals reported year-on-year revenue growth of 18.1%, and its $226.8 million of revenue exceeded Wall Street’s consensus estimates by 3.8%.
Looking ahead, sell-side analysts expect revenue to grow 71.2% over the next 12 months, according to S&P, an improvement versus the last two years. This strong outlook suggests its newer products and services will spur better top-line performance.
Adjusted operating margin
Adjusted operating margin is an important measure of profitability as it shows the portion of revenue left after accounting for all core expenses, from the cost of goods sold to advertising and wages. It’s also useful for comparing profitability across companies because it excludes non-recurring expenses, interest on debt and taxes.
Supernus Pharmaceuticals has been an efficient company over the last five years. It was one of the more profitable businesses in the healthcare sector, with an average adjusted operating margin of 21.9%.
Looking at the trend in its profitability, Supernus Pharmaceuticals’s adjusted operating margin decreased by 5.7 percentage points over the last five years. The decline was driven by more recent setbacks, as the company’s margin fell by 14.4 percentage points on a two-year basis. These disappointing results show its expenses were rising and it couldn’t pass those costs on to its customers.
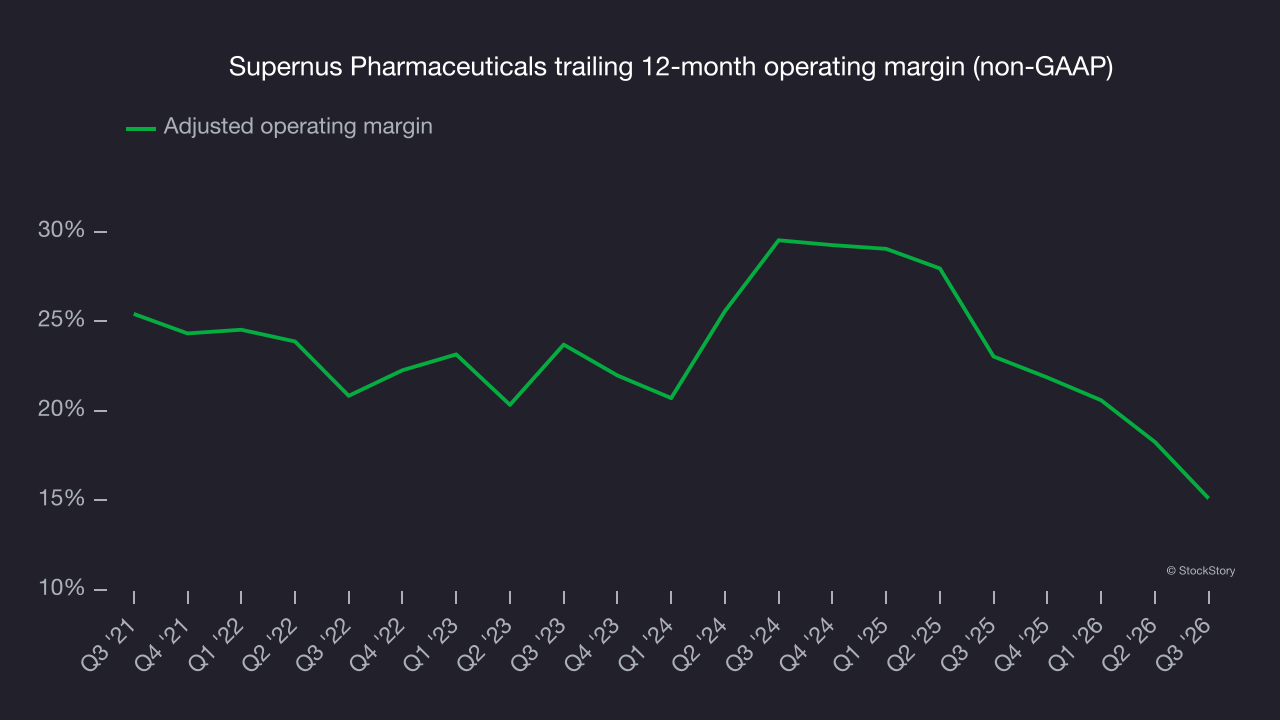
In Q3, Supernus Pharmaceuticals generated an adjusted operating margin of 9.3%, down 12.5 percentage points year on year. This contraction shows it was less efficient because its expenses grew faster than its revenue.
Earnings per share
Revenue trends explain a company’s historical growth, but the long-term change in earnings per share (EPS) points to the profitability of that growth – for example, a company could inflate its revenue through excessive spending on advertising and promotions.
Supernus Pharmaceuticals’s EPS declined by 20.2% annually over the last five years while its revenue grew by 7.6%. The company became less profitable on a per-share basis as it expanded.
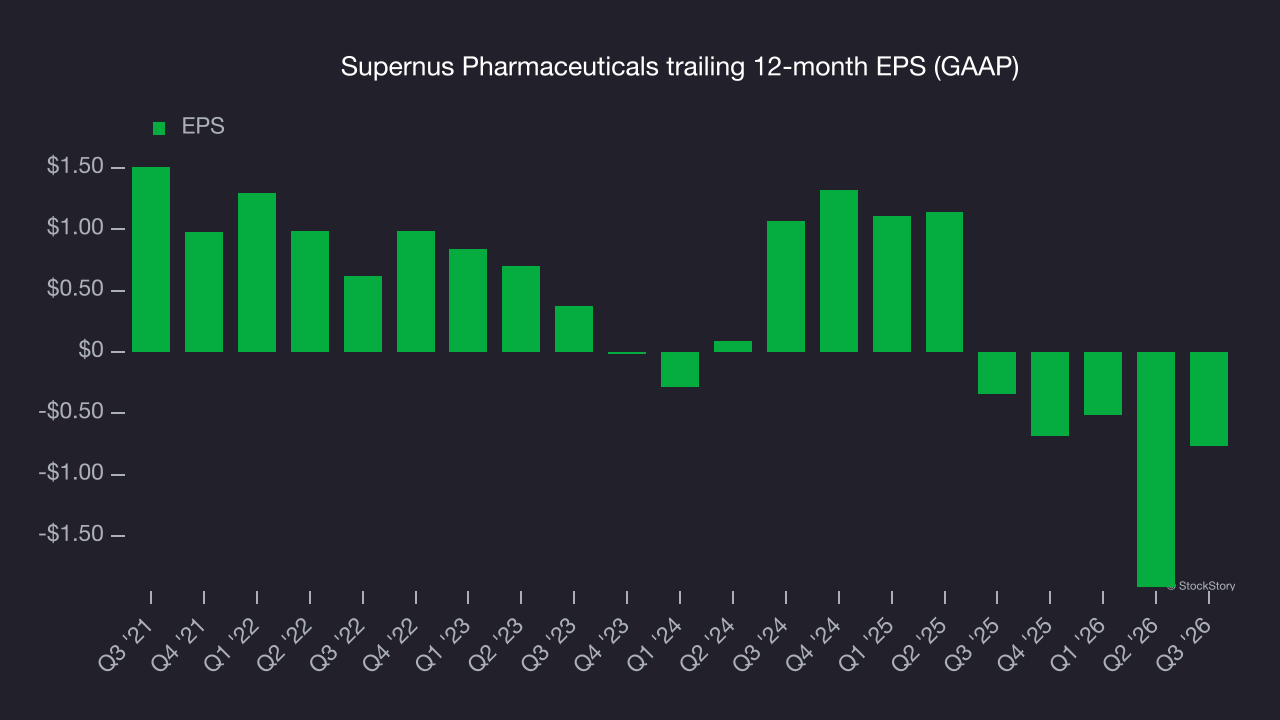
We can take a deeper look into Supernus Pharmaceuticals’s earnings to better understand the drivers of its performance. As we mentioned earlier, Supernus Pharmaceuticals’s adjusted operating margin declined by 5.7 percentage points over the last five years. Its share count also grew by 9.5%, meaning the company not only became less efficient with its operating expenses but also diluted its shareholders. 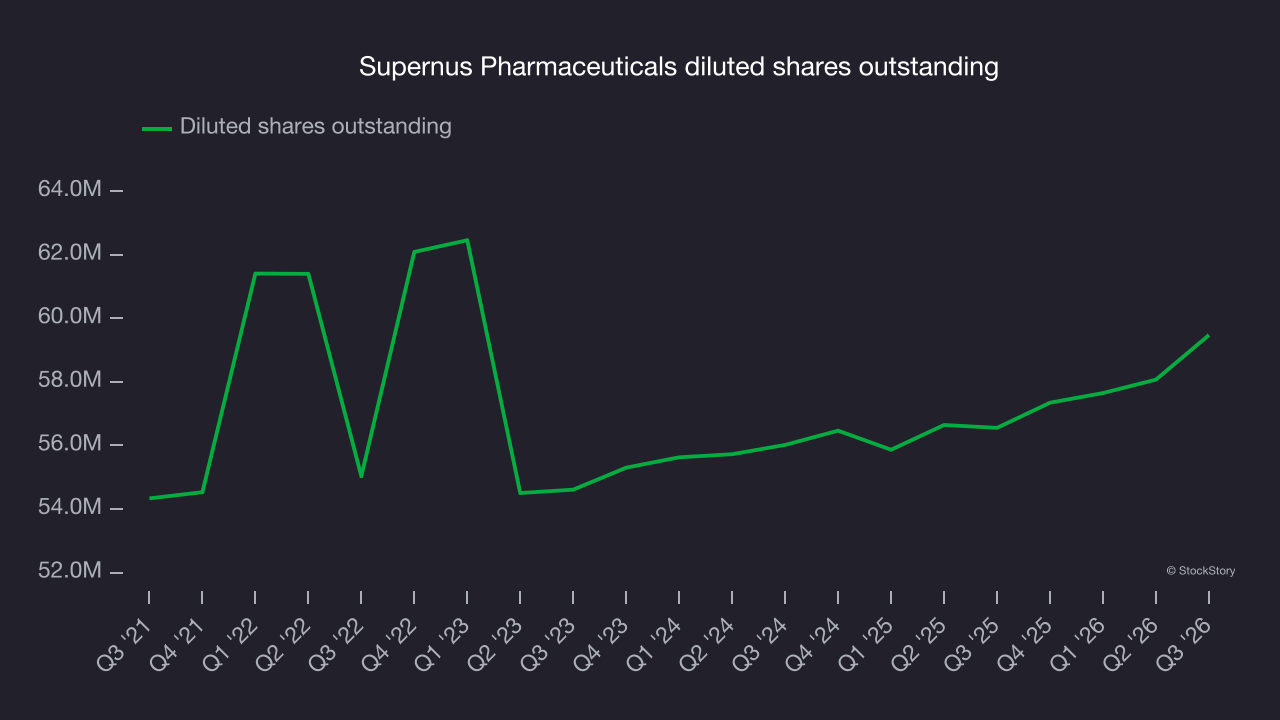
In Q3, Supernus Pharmaceuticals reported EPS of $0.35, up from negative $0.80 in the same quarter last year. EPS easily cleared analysts’ consensus estimates, a positive result for shareholders. Wall Street expects earnings to improve over the next 12 months. Analysts forecast Supernus Pharmaceuticals’s full-year EPS will turn positive, rising from negative $0.77 to positive $1.78, according to S&P.
Key takeaways from Supernus Pharmaceuticals’s Q3 results
Supernus Pharmaceuticals delivered a solid quarter, with both EPS and revenue topping Wall Street’s consensus estimates. Even with those beats, the market seemed to be hoping for more: shares fell 2.2% to $40.88 immediately after the results.
Considering an investment in Supernus Pharmaceuticals? The latest quarter is only one part of assessing its longer-term business quality. Quality, combined with valuation, can help determine if the stock is a buy. Read our full research report here (it’s free).