Private corrections company GEO Group (NYSE: GEO) missed Wall Street’s revenue expectations in Q3 2026, but revenue rose 11.5% year on year to $761.1 million. On the other hand, next quarter’s outlook exceeded expectations with revenue guided to $802 million at the midpoint, or 2.7% above analysts’ consensus estimates. Its non-GAAP profit of $0.39 per share was 13% above analysts’ consensus estimates.
For more on GEO Group, read our free full research report.
GEO Group (GEO) Q3 2026 highlights:
- Revenue $761.1 million vs S&P analysts’ consensus estimates of $769.1 million (11.5% year-on-year growth, 1.1% miss)
- Adjusted EPS $0.39 vs S&P analysts’ consensus estimates of $0.35 (13% beat)
- Adjusted EBITDA $145.3 million vs analysts’ consensus estimates of $140.5 million (19.1% margin, 3.5% beat)
- Revenue guidance $802 million at the midpoint for Q4 2026, above analysts’ consensus estimates of $780.7 million
- Adjusted EPS guidance $1.42 at the midpoint for the full year, beating analysts’ consensus estimates by 7.2%
- EBITDA guidance $570.5 million at the midpoint for the full year, above analysts’ consensus estimates of $553.9 million
- Operating margin 13.5%, up from 6% in the same quarter last year
- Market capitalization $3.56 billion
Revenue growth
Examining a company’s long-term performance can provide clues about its quality. Any business can have short-term success, but a top-tier one grows for years.
With $2.91 billion in revenue over the past 12 months, GEO Group is a mid-sized business services company, which sometimes brings disadvantages compared to larger competitors benefiting from better economies of scale.
GEO Group grew its revenue at a mediocre 5% compounded annual growth rate over the last five years. This shows it couldn’t generate substantial demand.
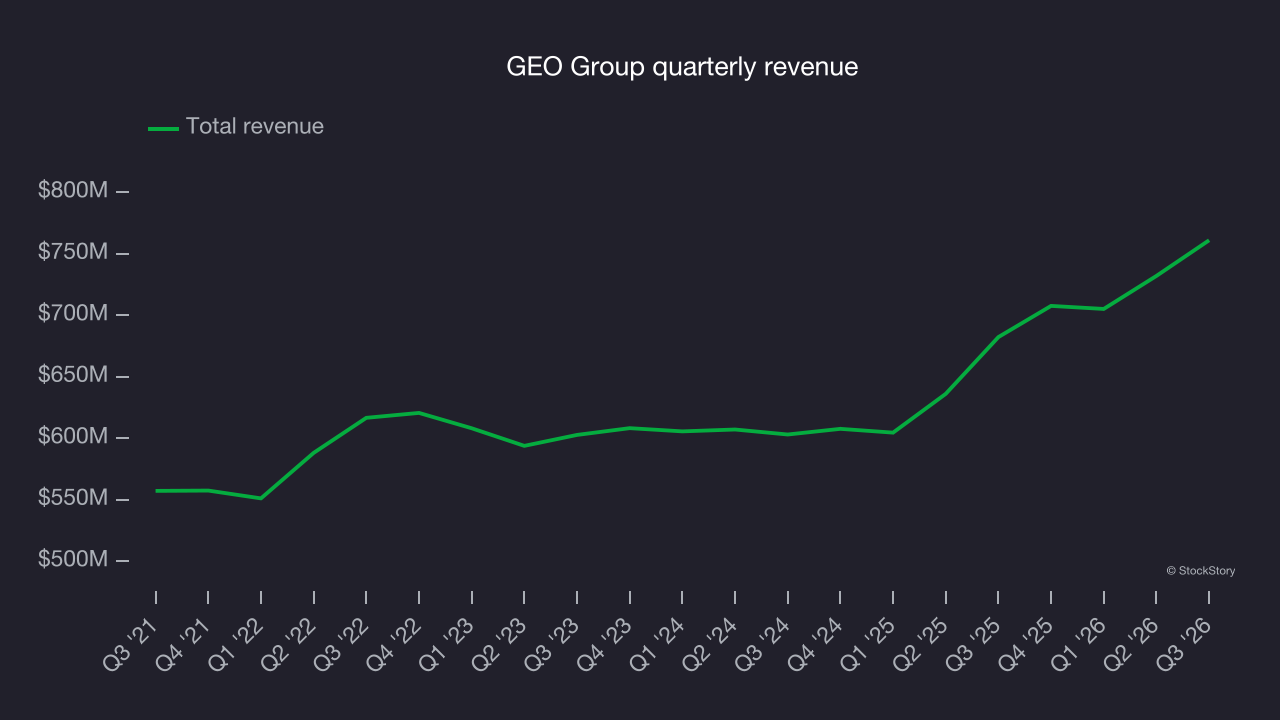
Long-term growth is the most important, but within business services, a half-decade historical view may miss new innovations or demand cycles. GEO Group’s annualized revenue growth of 9.5% over the last two years is above its five-year trend, suggesting its demand recently accelerated. 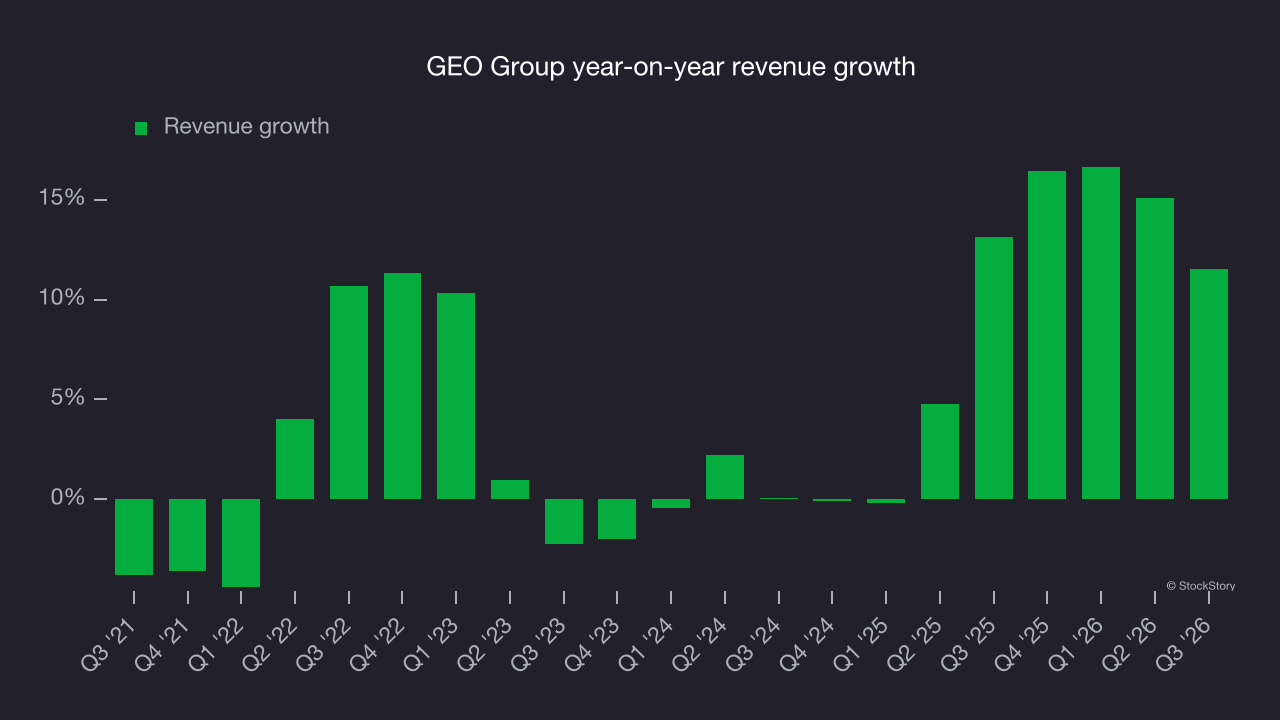
This quarter, GEO Group’s revenue grew by 11.5% year on year to $761.1 million but fell short of Wall Street’s consensus estimates. Management is guiding for a 13.3% year-on-year increase in revenue next quarter.
Looking further ahead, sell-side analysts expect revenue to grow 10.1% over the next 12 months, according to S&P, similar to its two-year rate. This favorable projection implies the market expects success for its products and services.
Adjusted operating margin
GEO Group has managed its cost base well over the last five years. It demonstrated solid profitability for a business services company, producing an average adjusted operating margin of 13.3%.
Looking at the trend in its profitability, GEO Group’s adjusted operating margin decreased by 2.2 percentage points over the last five years. This raises questions about the company’s expense base because its revenue growth should have given it leverage on its fixed costs, resulting in better economies of scale and profitability.
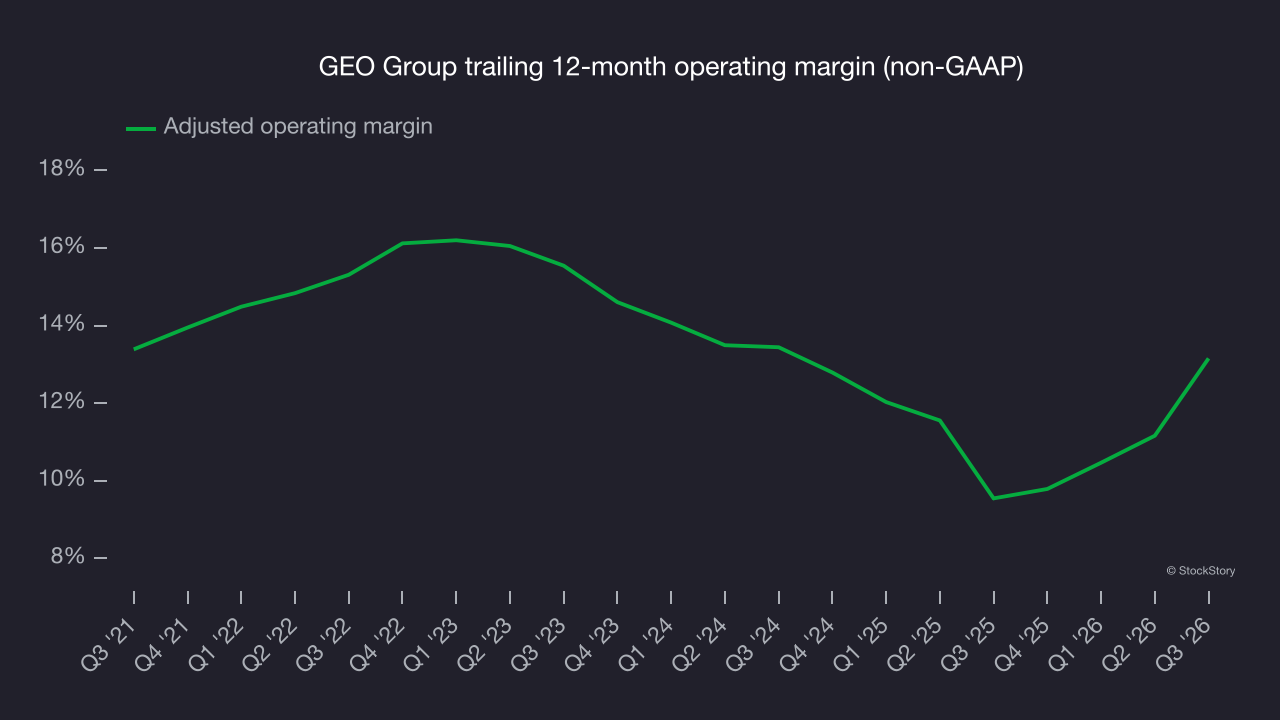
In Q3, GEO Group generated an adjusted operating margin of 14.1%, up 8.1 percentage points year on year. This improvement shows it operated more efficiently.
Earnings per share
Revenue trends explain a company’s historical growth, but the long-term change in earnings per share, or EPS, points to the profitability of that growth. For example, a company could inflate its revenue through excessive spending on advertising and promotions.
GEO Group’s EPS declined by 1.3% annually over the last five years while its revenue grew by 5%. This indicates the company became less profitable on a per-share basis as it expanded.
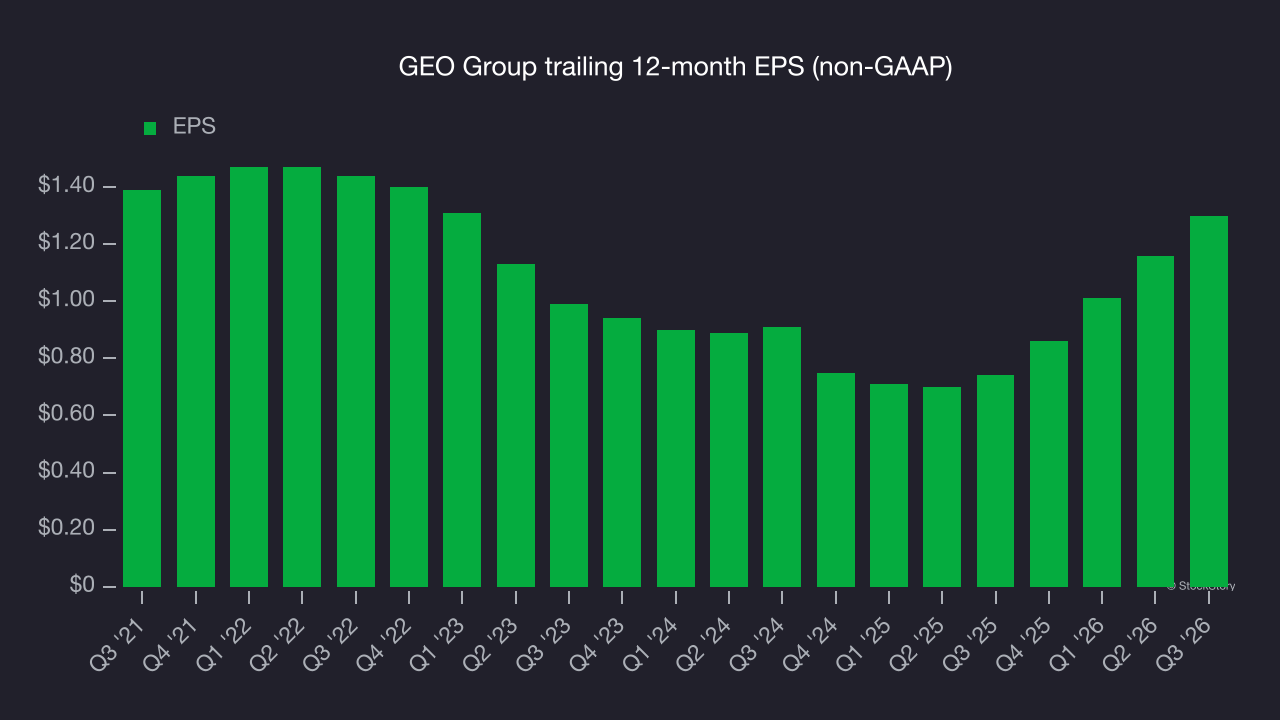
A closer look at GEO Group’s earnings helps explain its performance. As noted earlier, GEO Group’s adjusted operating margin expanded this quarter but declined by 2.2 percentage points over the last five years. Its share count also grew by 9.2%, meaning the company not only became less efficient with its operating expenses but also diluted its shareholders. 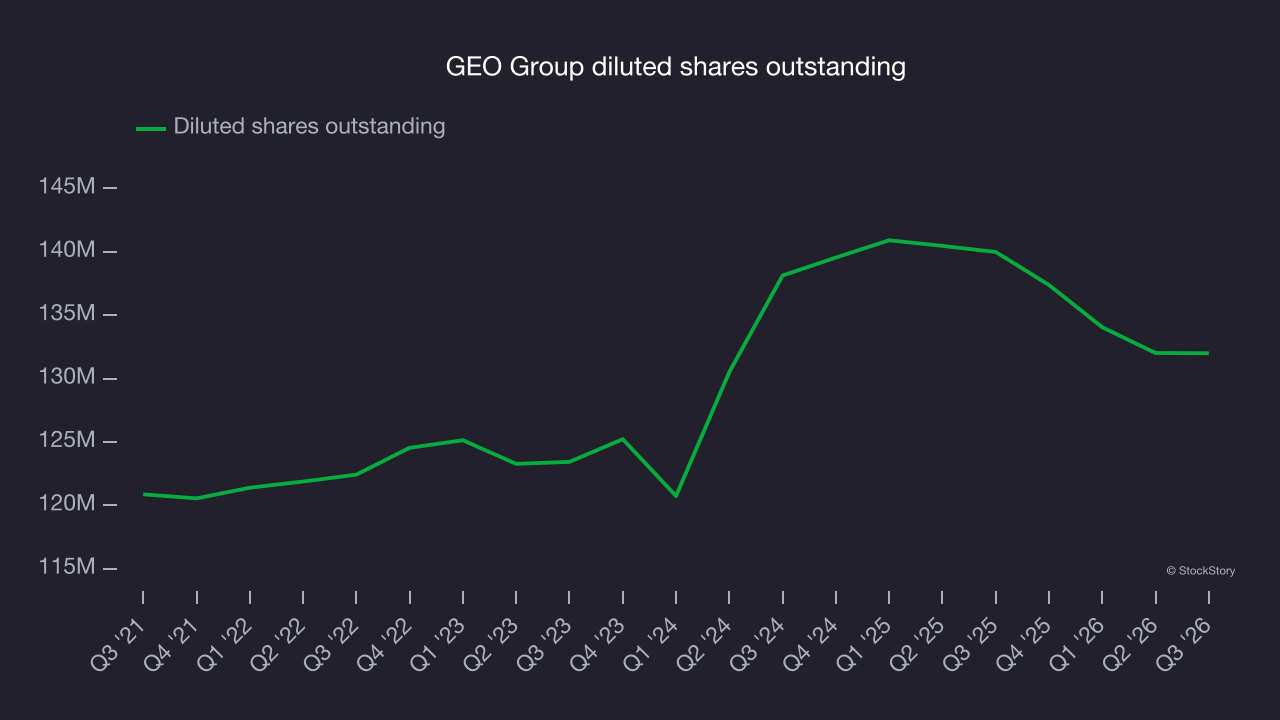
As with revenue, examining EPS over a more recent period can provide insight into an emerging theme or development for the business.
For GEO Group, its two-year annual EPS growth of 19.5% was higher than its five-year trend. This acceleration made it one of the faster-growing business services companies in recent history.
In Q3, GEO Group reported adjusted EPS of $0.39, up from $0.25 in the same quarter last year. This result easily cleared analysts’ consensus estimates, a positive for shareholders. Over the next 12 months, Wall Street expects GEO Group’s full-year EPS to grow 29.4% from $1.30 to $1.68, according to S&P.
Key takeaways from GEO Group’s Q3 results
GEO Group delivered a solid quarter, with next-quarter revenue guidance well above analysts’ consensus estimates and full-year EPS guidance topping Wall Street’s consensus by a wide margin. Revenue for the quarter, however, fell slightly short of expectations. Shares rose 3.8% to $28.58 immediately after the results.
GEO Group had a solid quarter, but is the stock a buy in the longer term? That decision requires considering its valuation and business quality as well as what happened in the latest quarter. For more on GEO Group, read the full research report here (it’s free).