Since May 2021, the S&P 500 has delivered a total return of 81.6%. But one standout stock has more than doubled the market - over the past five years, Ryder has surged 172% to $230.65 per share. Its momentum hasn’t stopped as it’s also gained 38.9% in the last six months thanks to its solid quarterly results, beating the S&P by 25.6%.
Is now the time to buy Ryder, or should you be careful about including it in your portfolio? Dive into our full research report to see our analyst team’s opinion, it’s free.
Why Is Ryder Not Exciting?
Despite the momentum, we're sitting this one out for now. Here are three reasons why R doesn't excite us and a stock we'd rather own.
1. Lackluster Revenue Growth
We at StockStory place the most emphasis on long-term growth, but within industrials, a stretched historical view may miss cycles, industry trends, or a company capitalizing on catalysts such as a new contract win or a successful product line. Ryder’s recent performance shows its demand has slowed as its annualized revenue growth of 3% over the last two years was below its five-year trend. We’re wary when companies in the sector see decelerations in revenue growth, as it could signal changing consumer tastes aided by low switching costs. 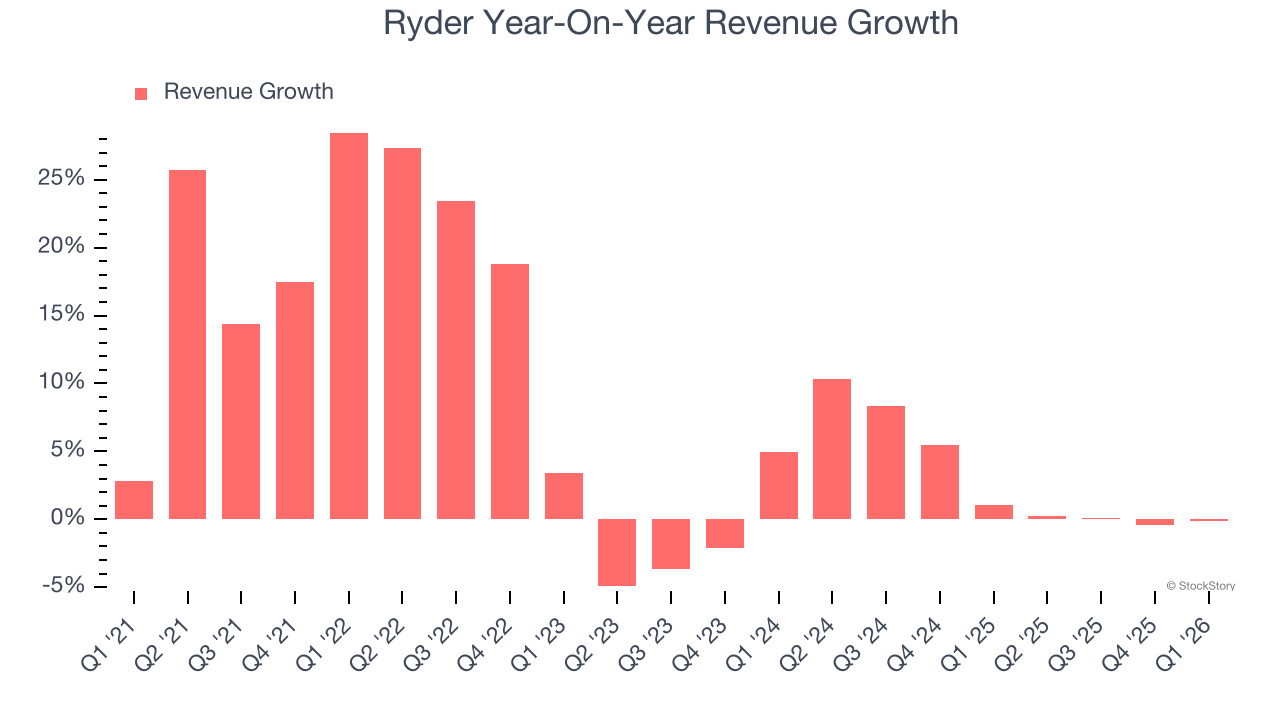
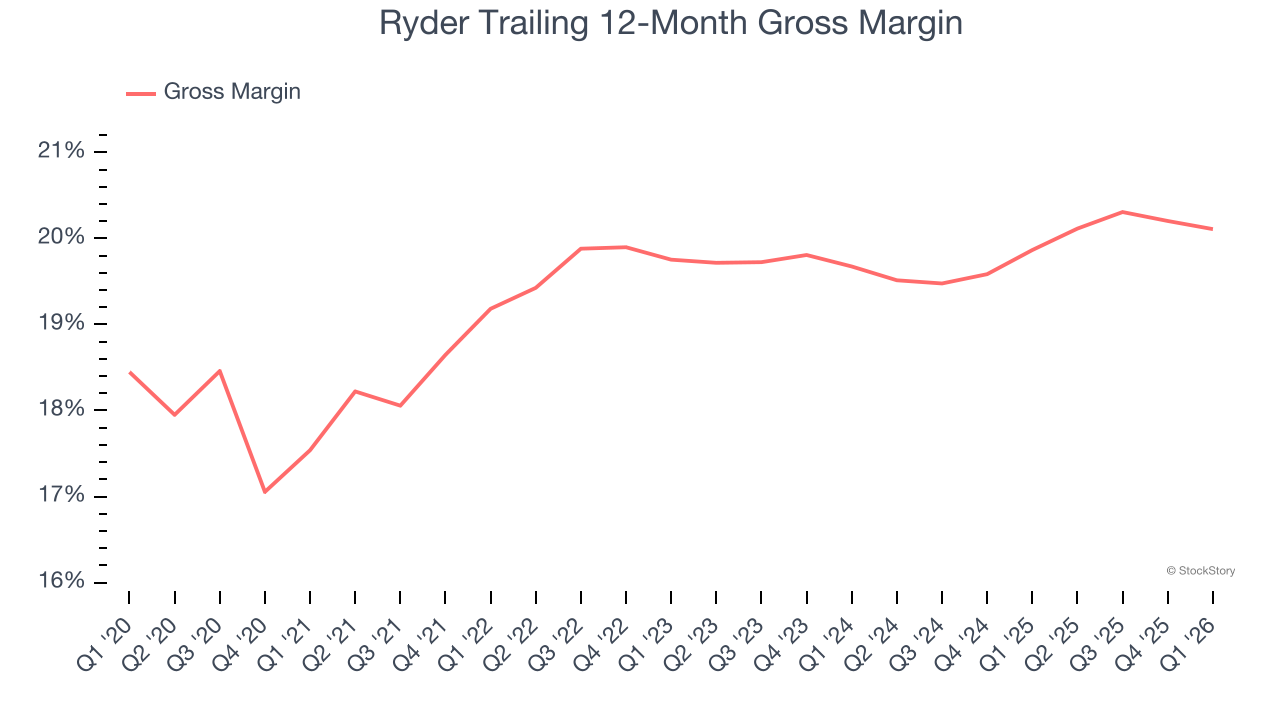
2. Low Gross Margin Reveals Weak Structural Profitability
All else equal, we prefer higher gross margins because they usually indicate that a company sells more differentiated products and commands stronger pricing power.
Ryder has bad unit economics for an industrials business, signaling it operates in a competitive market. As you can see below, it averaged a 19.7% gross margin over the last five years. Said differently, Ryder had to pay a chunky $80.26 to its suppliers for every $100 in revenue.
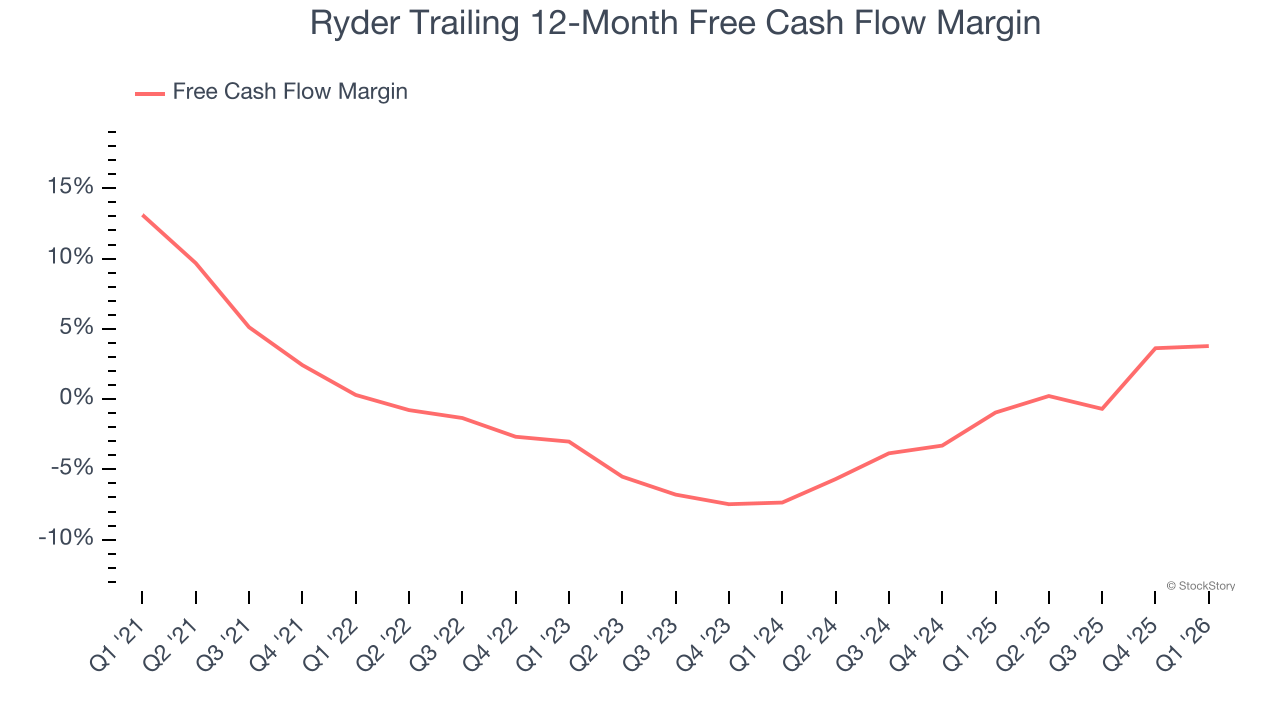
3. Cash Burn Ignites Concerns
Free cash flow isn't a prominently featured metric in company financials and earnings releases, but we think it's telling because it accounts for all operating and capital expenses, making it tough to manipulate. Cash is king.
While Ryder posted positive free cash flow this quarter, the broader story hasn’t been so clean. Ryder’s demanding reinvestments have drained its resources over the last five years, putting it in a pinch and limiting its ability to return capital to investors. Its free cash flow margin averaged negative 1.4%, meaning it lit $1.44 of cash on fire for every $100 in revenue.
Final Judgment
Ryder isn’t a terrible business, but it doesn’t pass our quality test. With its shares beating the market recently, the stock trades at 15.3× forward P/E (or $230.65 per share). This valuation is reasonable, but the company’s shakier fundamentals present too much downside risk. We're pretty confident there are more exciting stocks to buy at the moment. We’d recommend looking at an all-weather company that owns household favorite Taco Bell.
High-Quality Stocks for All Market Conditions
WHILE YOU’RE HERE: Top 9 Market-Beating Stocks. The best stocks don't just beat the market once. They do it again. And again. Robust revenue growth, rising free cash flow, returns on capital that leave their competition in the dust. The market has already rewarded these businesses.
But our AI platform says the party isn't over. Find out which 9 stocks made the cut this week - FREE. Get Our Top 9 Market-Beating Stocks for Free HERE.
Stocks that have made our list include now familiar names such as Nvidia (+1,326% between June 2020 and June 2025) as well as under-the-radar businesses like the once-micro-cap company Kadant (+351% five-year return). Find your next big winner with StockStory today.