Automotive services company Driven Brands (NASDAQ: DRVN) met Wall Street’s revenue expectations in Q4 CY2025, but sales fell by 18.4% year on year to $460.1 million. On the other hand, the company’s full-year revenue guidance of $2 billion at the midpoint came in 1.2% below analysts’ estimates. Its non-GAAP profit of $0.34 per share was 42.4% above analysts’ consensus estimates.
Is now the time to buy Driven Brands? Find out by accessing our full research report, it’s free.
Driven Brands (DRVN) Q4 CY2025 Highlights:
- Revenue: $460.1 million vs analyst estimates of $462.1 million (18.4% year-on-year decline, in line)
- Adjusted EPS: $0.34 vs analyst estimates of $0.24 (42.4% beat)
- Adjusted EBITDA: $111.9 million vs analyst estimates of $109.2 million (24.3% margin, 2.5% beat)
- Adjusted EPS guidance for the upcoming financial year 2026 is $1.20 at the midpoint, missing analyst estimates by 2.2%
- EBITDA guidance for the upcoming financial year 2026 is $445 million at the midpoint, below analyst estimates of $467.6 million
- Operating Margin: 17%, up from -61.7% in the same quarter last year
- Same-Store Sales were flat year on year (3.1% in the same quarter last year)
- Market Capitalization: $2.34 billion
Company Overview
With approximately 5,000 locations across 49 U.S. states and 13 other countries, Driven Brands (NASDAQ: DRVN) operates a network of automotive service centers offering maintenance, car washes, paint, collision repair, and glass services across North America.
Revenue Growth
Examining a company’s long-term performance can provide clues about its quality. Any business can put up a good quarter or two, but the best consistently grow over the long haul.
With $1.99 billion in revenue over the past 12 months, Driven Brands is a mid-sized business services company, which sometimes brings disadvantages compared to larger competitors benefiting from better economies of scale. On the bright side, it can still flex high growth rates because it’s working from a smaller revenue base.
As you can see below, Driven Brands’s sales grew at an incredible 17.1% compounded annual growth rate over the last five years. This shows it had high demand, a useful starting point for our analysis.
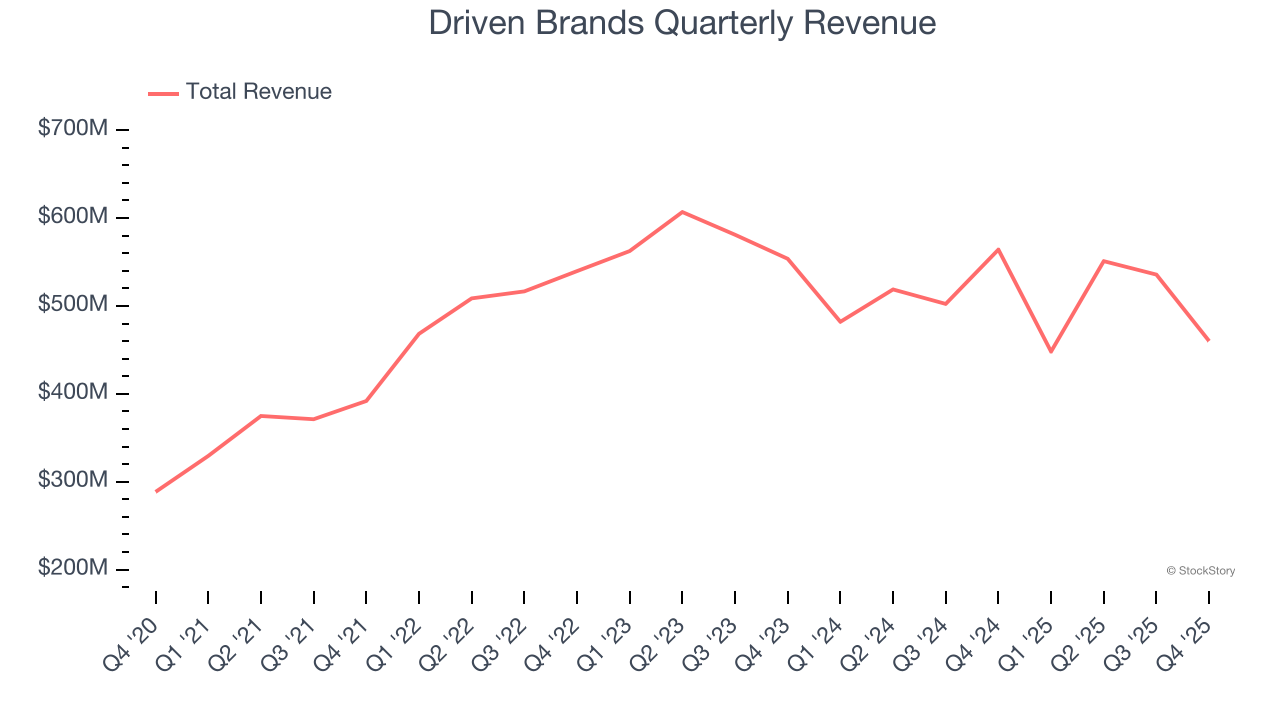
Long-term growth is the most important, but within business services, a half-decade historical view may miss new innovations or demand cycles. Driven Brands’s recent performance marks a sharp pivot from its five-year trend as its revenue has shown annualized declines of 6.9% over the last two years. 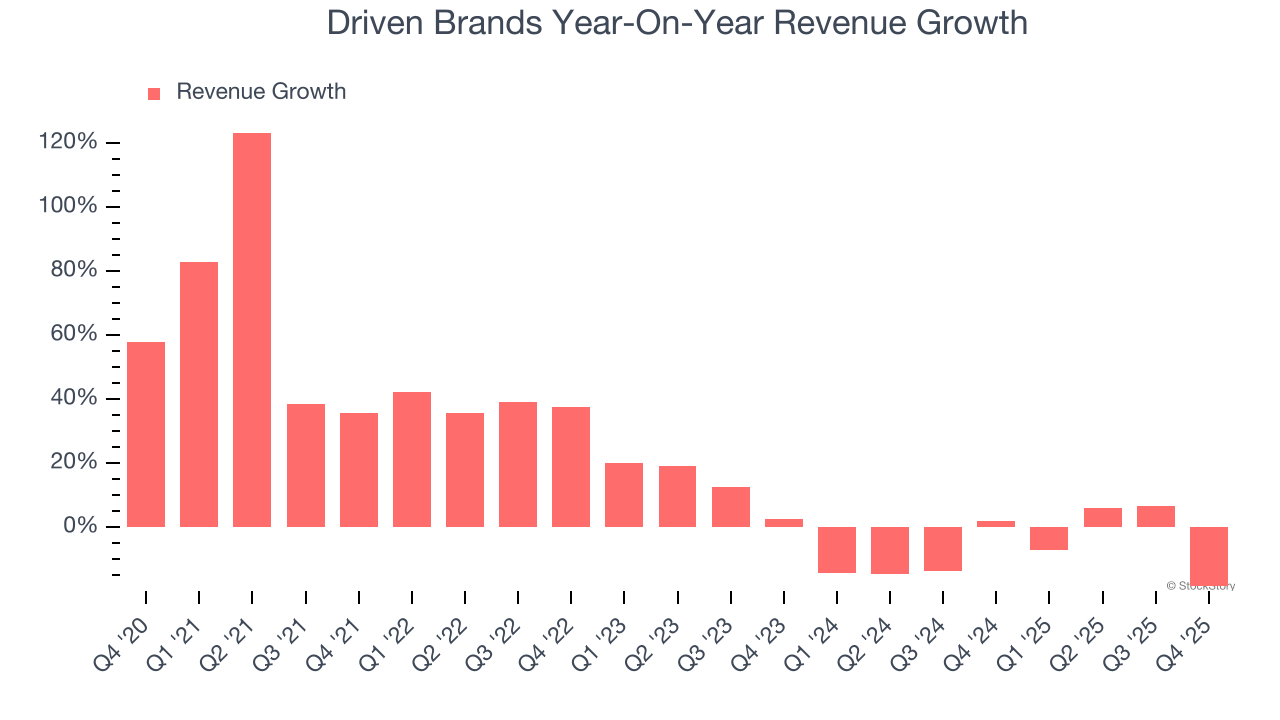
Driven Brands also reports same-store sales, which show how much revenue its established locations generate. Over the last two years, Driven Brands’s same-store sales averaged 1.5% year-on-year growth. Because this number is better than its revenue growth, we can see its sales from existing locations are performing better than its sales from new locations. 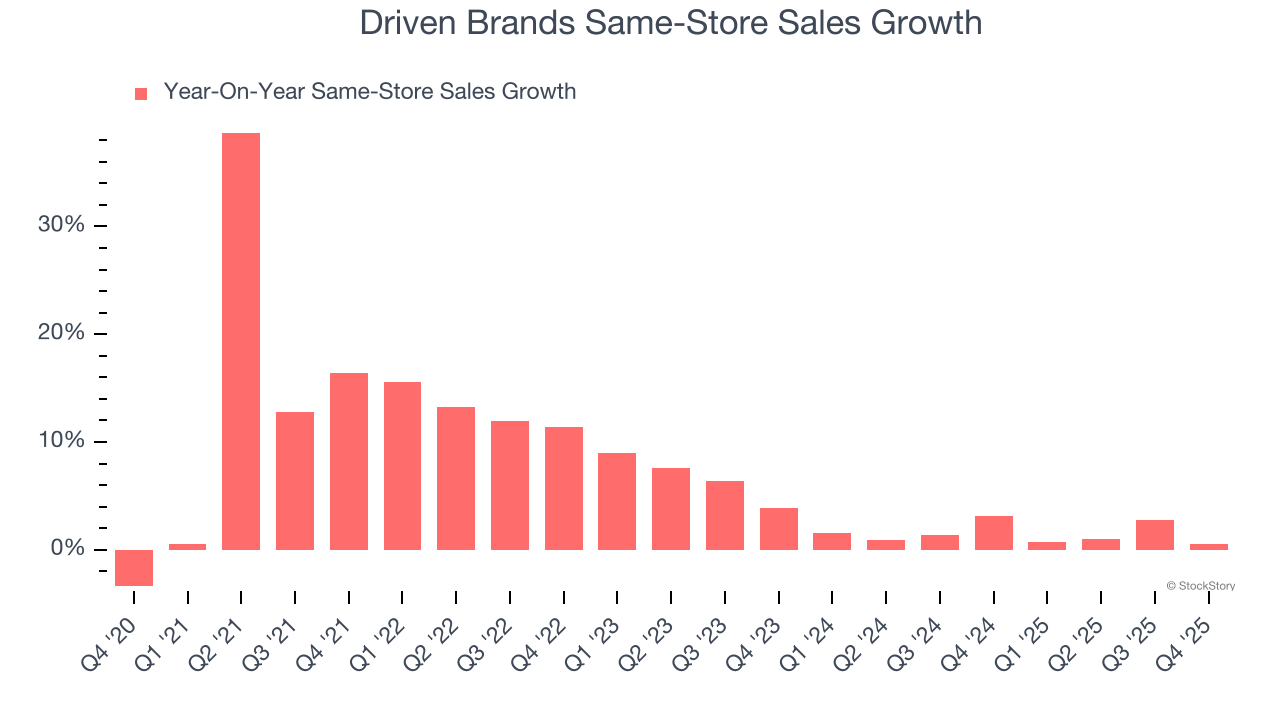
This quarter, Driven Brands reported a rather uninspiring 18.4% year-on-year revenue decline to $460.1 million of revenue, in line with Wall Street’s estimates.
Looking ahead, sell-side analysts expect revenue to grow 2.8% over the next 12 months. While this projection implies its newer products and services will fuel better top-line performance, it is still below the sector average.
ONE MORE THING: The $21 AI Application Stock Wall Street Forgot. While Wall Street obsesses over who’s building AI, one company is already using it to print money. And nobody’s paying attention.
AI chip stocks trade at ridiculous valuations. This company processes a trillion consumer signals monthly using AI and trades at a third of the price. The gap won’t last. The institutions will figure it out. You need to see this first. Read the FREE Report Before They Notice.
Adjusted Operating Margin
Adjusted operating margin is one of the best measures of profitability because it tells us how much money a company takes home after subtracting all core expenses, like marketing and R&D. It also removes various one-time costs to paint a better picture of normalized profits.
Driven Brands’s adjusted operating margin has generally stayed the same over the last 12 months, averaging 18.1% over the last five years. This profitability was elite for a business services business thanks to its efficient cost structure and economies of scale.
Looking at the trend in its profitability, Driven Brands’s adjusted operating margin might fluctuated slightly but has generally stayed the same over the last five years. This raises questions about the company’s expense base because its revenue growth should have given it leverage on its fixed costs, resulting in better economies of scale and profitability.
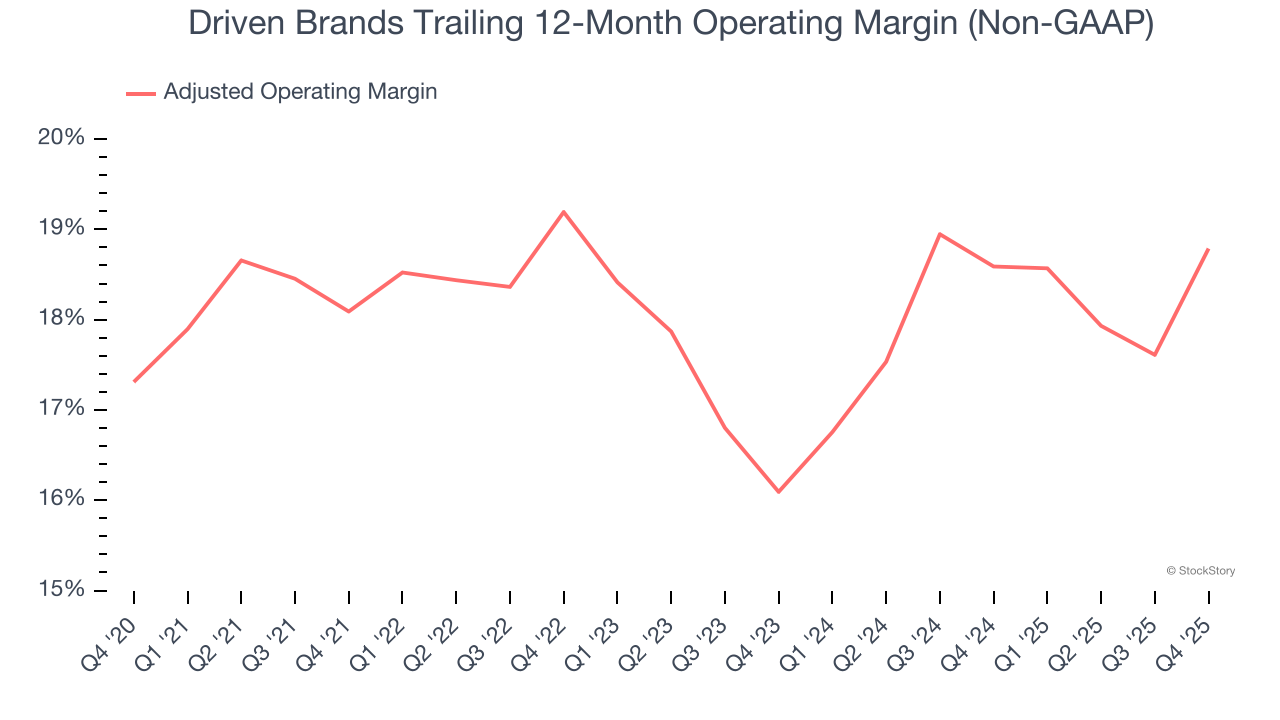
In Q4, Driven Brands generated an adjusted operating margin profit margin of 18.3%, up 4.3 percentage points year on year. This increase was a welcome development, especially since its revenue fell, showing it was more efficient because it scaled down its expenses.
Earnings Per Share
Revenue trends explain a company’s historical growth, but the long-term change in earnings per share (EPS) points to the profitability of that growth – for example, a company could inflate its sales through excessive spending on advertising and promotions.
Driven Brands’s full-year EPS grew at a solid 10.5% compounded annual growth rate over the last four years, better than the broader business services sector.
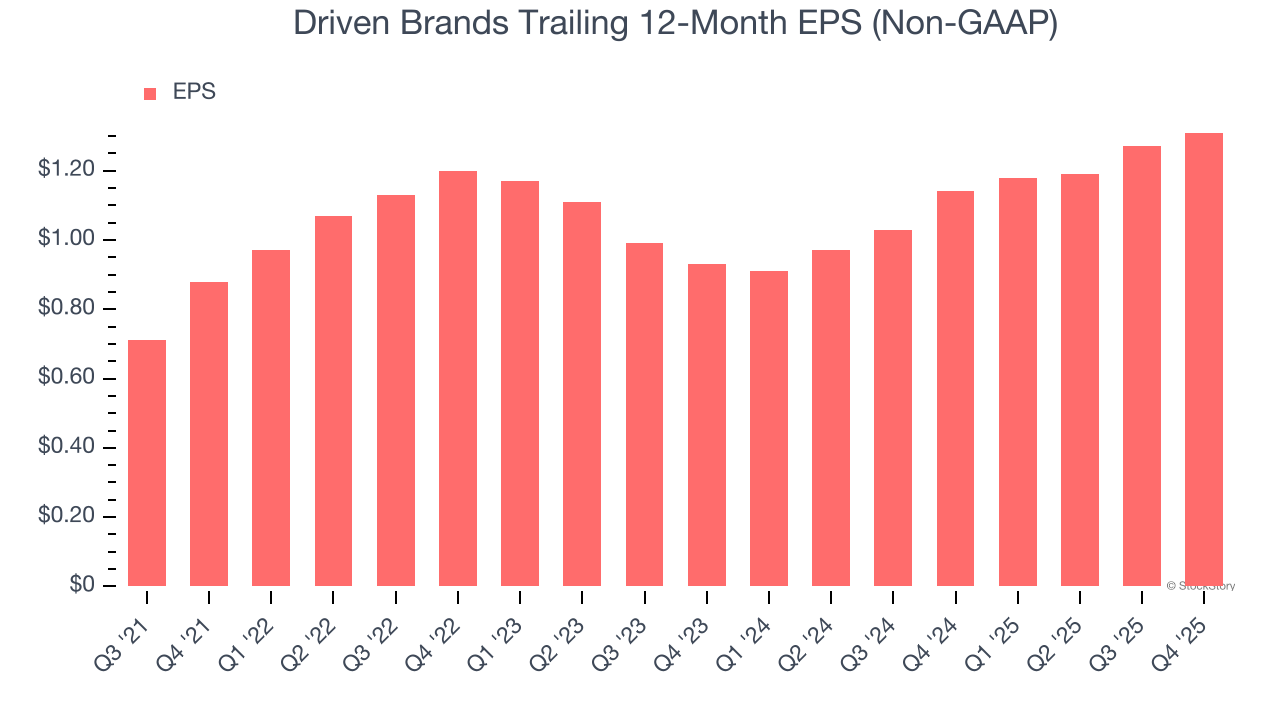
Like with revenue, we analyze EPS over a shorter period to see if we are missing a change in the business.
Driven Brands’s EPS grew at a spectacular 18.7% compounded annual growth rate over the last two years, higher than its 6.9% annualized revenue declines. This tells us management adapted its cost structure in response to a challenging demand environment.
Diving into the nuances of Driven Brands’s earnings can give us a better understanding of its performance. Driven Brands’s adjusted operating margin has expanded over the last two years. This was the most relevant factor (aside from the revenue impact) behind its higher earnings; interest expenses and taxes can also affect EPS but don’t tell us as much about a company’s fundamentals.
In Q4, Driven Brands reported adjusted EPS of $0.34, up from $0.30 in the same quarter last year. This print easily cleared analysts’ estimates, and shareholders should be content with the results. Over the next 12 months, Wall Street expects Driven Brands’s full-year EPS to shrink by 6.2% from $1.31 to $1.23.
Key Takeaways from Driven Brands’s Q4 Results
It was good to see Driven Brands beat analysts’ EPS expectations this quarter. On the other hand, its full-year EPS guidance missed and its full-year revenue guidance fell slightly short of Wall Street’s estimates. Overall, this quarter could have been better. The stock traded down 3.1% to $13.80 immediately following the results.
Big picture, is Driven Brands a buy here and now? When making that decision, it’s important to consider its valuation, business qualities, as well as what has happened in the latest quarter. We cover that in our actionable full research report which you can read here (it’s free).