Deckers trades at $106.63 per share and has stayed right on track with the overall market, gaining 5.9% over the last six months. At the same time, the S&P 500 has returned 8.7%.
Is now the time to buy Deckers, or should you be careful about including it in your portfolio? Get the full stock story straight from our expert analysts, it’s free.
Why Do We Think Deckers Will Underperform?
We’re swiping left on Deckers for now. Here are three reasons why DECK doesn’t excite us, plus one stock we’d rather own.
1. Weak Constant Currency Growth Points to Soft Demand
In addition to reported revenue, constant currency revenue is a useful data point for analyzing Consumer Discretionary - Footwear companies. This metric excludes currency movements, which are outside of Deckers’s control and are not indicative of underlying demand.
Over the last two years, Deckers’s constant currency revenue averaged 13.3% year-on-year growth. This performance was underwhelming and suggests it might have to lower prices or invest in product improvements to accelerate growth, factors that can hinder near-term profitability. 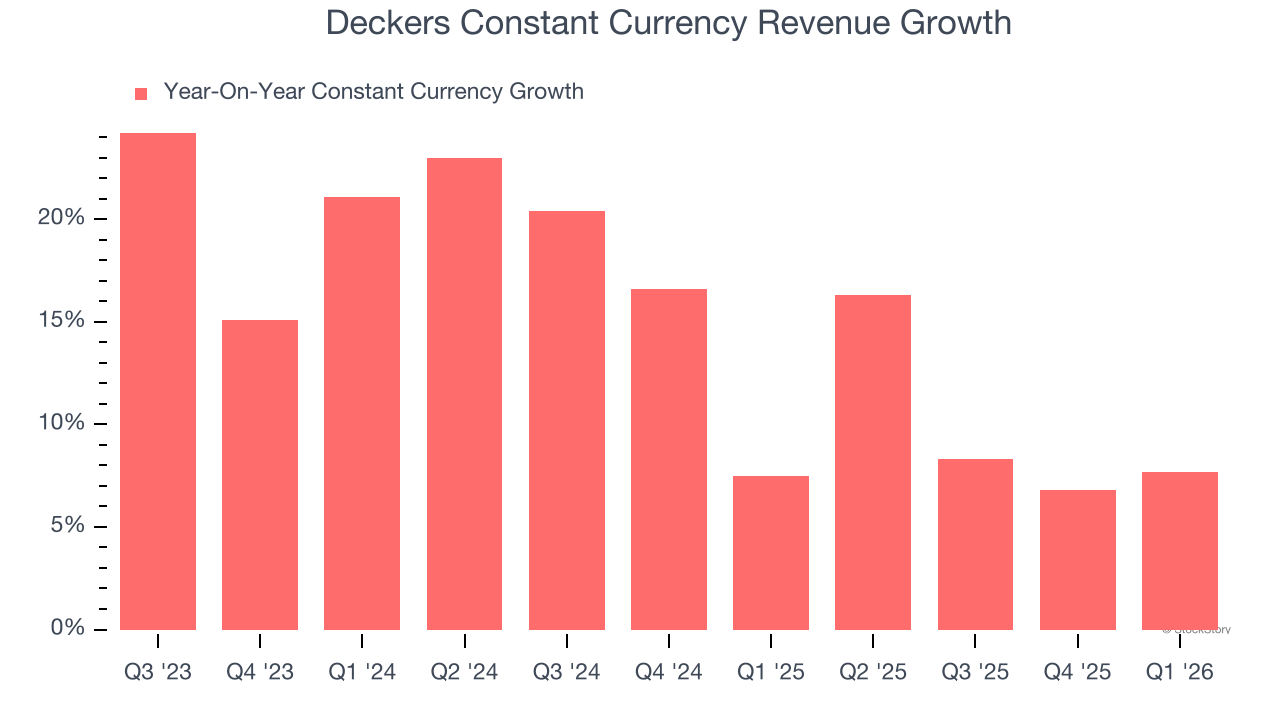
2. Weak Operating Margin Could Cause Trouble
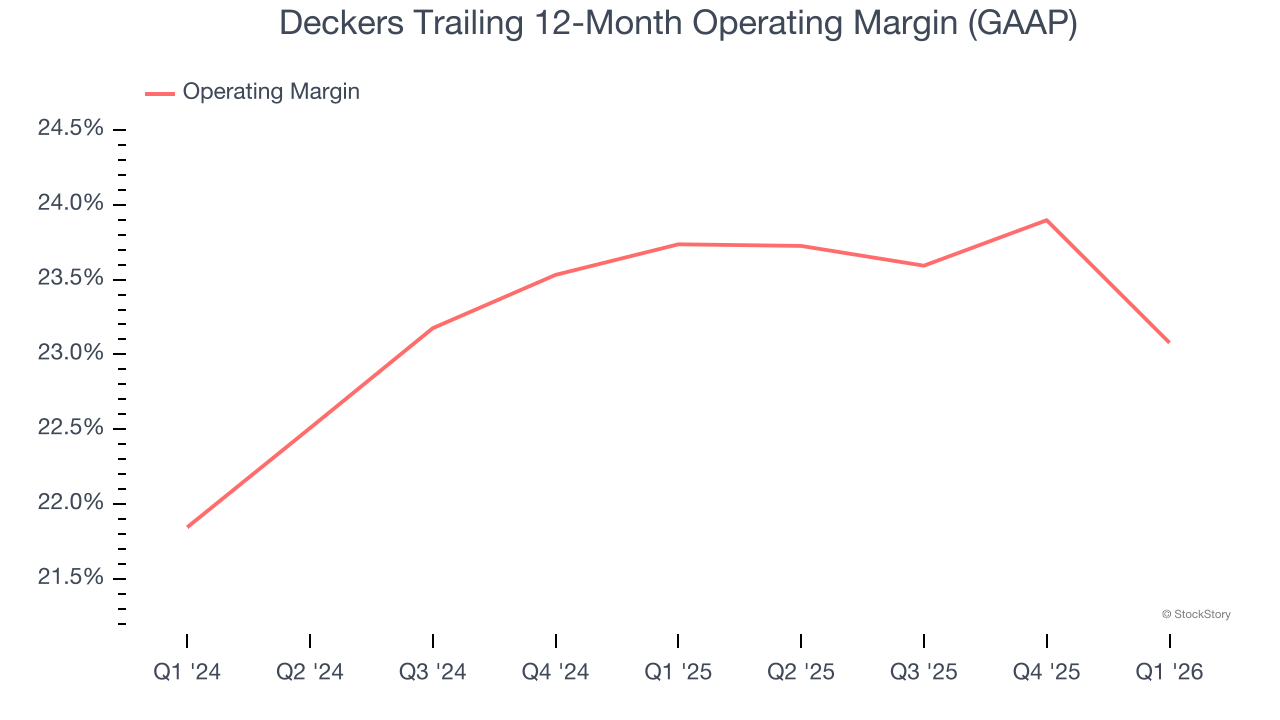
Operating margin is an important measure of profitability as it shows the portion of revenue left after accounting for all core expenses — everything from the cost of goods sold to advertising and wages. It’s also useful for comparing profitability across companies with different levels of debt and tax rates because it excludes interest and taxes.
Deckers’s operating margin has generally stayed the same over the last 12 months, and we generally like to see margin increases due to economies of scale and cost efficiency over time.
3. Cash Flow Margin Set to Decline
If you’ve followed StockStory for a while, you know we emphasize free cash flow. Why, you ask? We believe that in the end, cash is king, and you can’t use accounting profits to pay the bills.
Over the next year, analysts predict Deckers’s cash conversion will fall. Their consensus estimates imply its free cash flow margin of 20.1% for the last 12 months will decrease to 15%.
Final Judgment
We cheer for all companies serving everyday consumers, but in the case of Deckers, we’ll be cheering from the sidelines. That said, the stock currently trades at 14.2× forward P/E (or $106.63 per share). This valuation multiple is fair, but we don’t have much confidence in the company. There are more exciting stocks to buy at the moment. We’d suggest looking at the Amazon and PayPal of Latin America.
Stocks We Would Buy Instead of Deckers
ONE MORE THING: Top 6 Stocks for This Week. This market is separating quality stocks from expensive ones fast. AI is taking down whole sectors with no warning. In a rotation this fast, you need more than a list of good companies.
Our AI system flagged Palantir before it ran 1,662% between October 2022 and February 2026. AppLovin before it ran 753% between February 2024 and February 2026. Nvidia before it ran 1,178% between January 2023 and February 2026. Each week it produces 6 new names that pass the same tests. Get Our Top 6 Stocks for Free HERE.
Stocks that have made our list include now familiar names such as Nvidia (+1,460% between June 2020 and June 2025) as well as under-the-radar businesses like the once-small-cap company Comfort Systems (+1,154% between June 2020 and June 2025). Find your next big winner with StockStory today.