The past six months have been a windfall for GEO Group’s shareholders. The company’s stock price has jumped 87.3%, hitting $30.57 per share. This was partly thanks to its solid quarterly results, and the run-up might have investors contemplating their next move.
Is there a buying opportunity in GEO Group, or does it present a risk to your portfolio? Get the full breakdown from our expert analysts, it’s free.
Why Is GEO Group Not Exciting?
Despite the momentum, we’re cautious about GEO Group. Here are three reasons we avoid GEO, plus one stock we’d rather own.
1. Long-Term Revenue Growth Disappoints
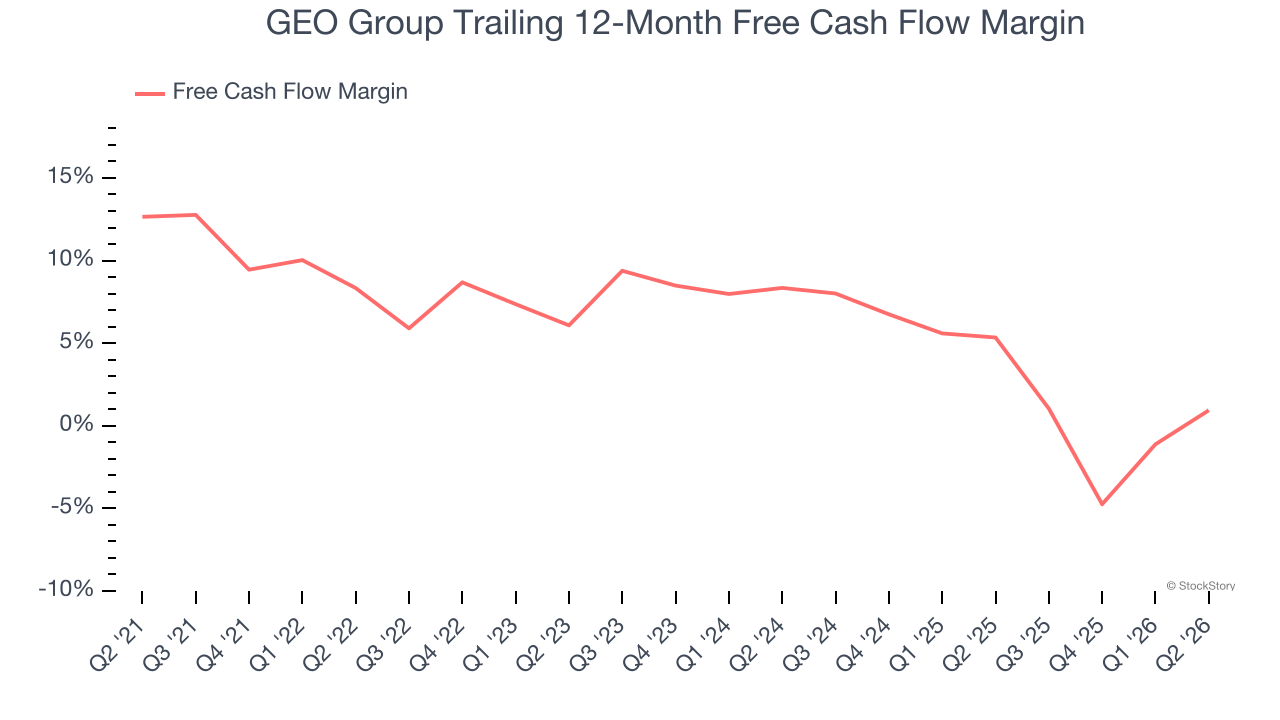
A company’s long-term sales performance can indicate its overall quality. Any business can experience short-term success, but top-performing ones enjoy sustained growth for years. Unfortunately, GEO Group’s 4.2% annualized revenue growth over the last five years was mediocre. This was below our standard for the business services sector.
2. Shrinking Adjusted Operating Margin
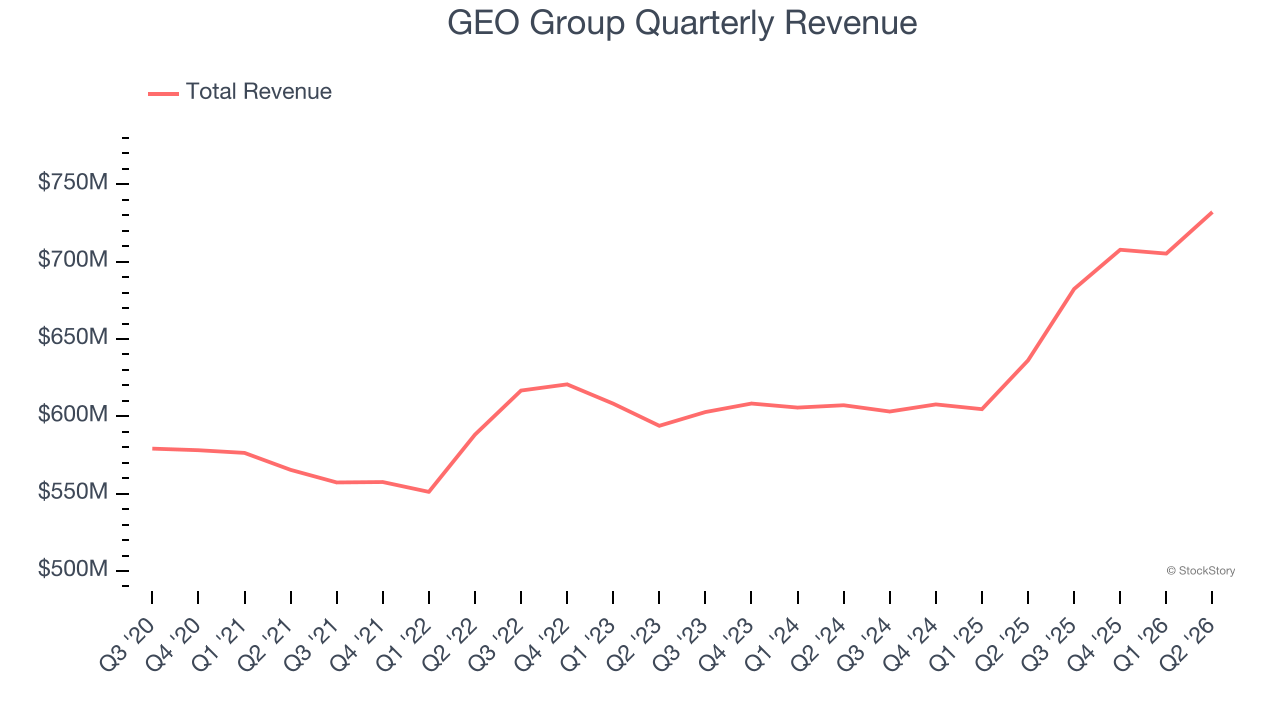
Adjusted operating margin is one of the best measures of profitability because it tells us how much money a company takes home after subtracting all core expenses, like marketing and R&D. It also removes various one-time costs to paint a better picture of normalized profits.
Looking at the trend in its profitability, GEO Group’s adjusted operating margin decreased by 3.7 percentage points over the last five years. This raises questions about the company’s expense base because its revenue growth should have given it leverage on its fixed costs, resulting in better economies of scale and profitability. Its adjusted operating margin for the trailing 12 months was 11.2%.
3. Free Cash Flow Margin Dropping
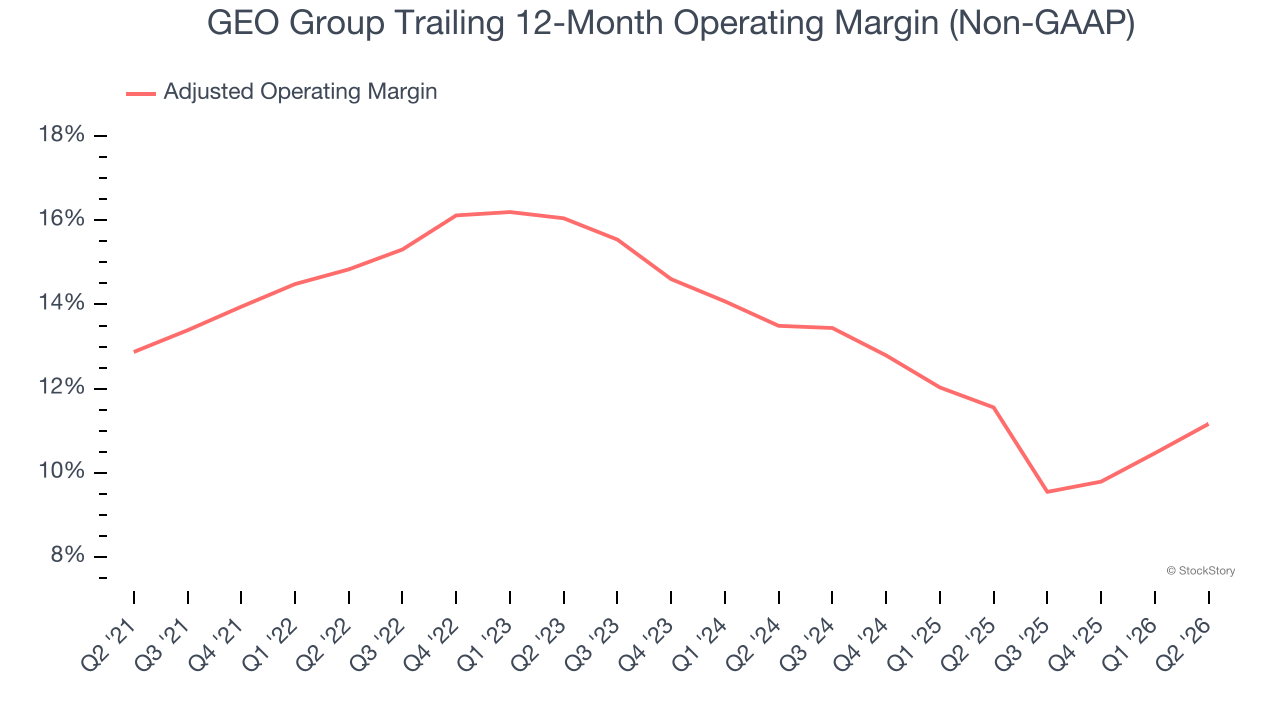
Free cash flow isn’t a prominently featured metric in company financials and earnings releases, but we think it’s telling because it accounts for all operating and capital expenses, making it tough to manipulate. Cash is king.
As you can see below, GEO Group’s margin dropped by 7.4 percentage points over the last five years. If its declines continue, it could signal increasing investment needs and capital intensity. GEO Group’s free cash flow margin for the trailing 12 months was breakeven.
Final Judgment
GEO Group isn’t a terrible business, but it isn’t one of our picks. Following the recent rally, the stock trades at 21.5× forward P/E (or $30.57 per share). Investors with a higher risk tolerance might like the company, but we don’t really see a big opportunity at the moment. We’re fairly confident there are better investments elsewhere. We’d suggest looking at one of Charlie Munger’s all-time favorite businesses.
Stocks We Would Buy Instead of GEO Group
ONE MORE THING: Top 6 Stocks for This Week. This market is separating quality stocks from expensive ones fast. AI is taking down whole sectors with no warning. In a rotation this fast, you need more than a list of good companies.
Our AI system flagged Palantir before it ran 1,662% between October 2022 and February 2026. AppLovin before it ran 753% between February 2024 and February 2026. Nvidia before it ran 1,178% between January 2023 and February 2026. Each week it produces 6 new names that pass the same tests. Get Our Top 6 Stocks for Free HERE.
Stocks that have made our list include now familiar names such as Nvidia (+1,460% between June 2020 and June 2025) as well as under-the-radar businesses like the once-micro-cap company Kadant (+214% between June 2020 and June 2025). Find your next big winner with StockStory today.