Calendar spreads are a versatile options strategy that allows traders to capitalize on time decay and changes in implied volatility.
This strategy involves selling a short-term option while simultaneously buying a longer-term option at the same strike price, creating a position that benefits from the passing of time and potential volatility shifts.
Calendar spreads are often used when traders expect limited price movement in the short term but anticipate increased volatility or a directional move later on.
They can be structured with calls or puts, making them useful for both bullish and bearish outlooks.
Let’s take a look at Barchart’s Long Call Calendar Screener for January 6th.
I have added a filter for Market Cap above 40b and total call volume above 2,000 to remove small capitalization stocks.
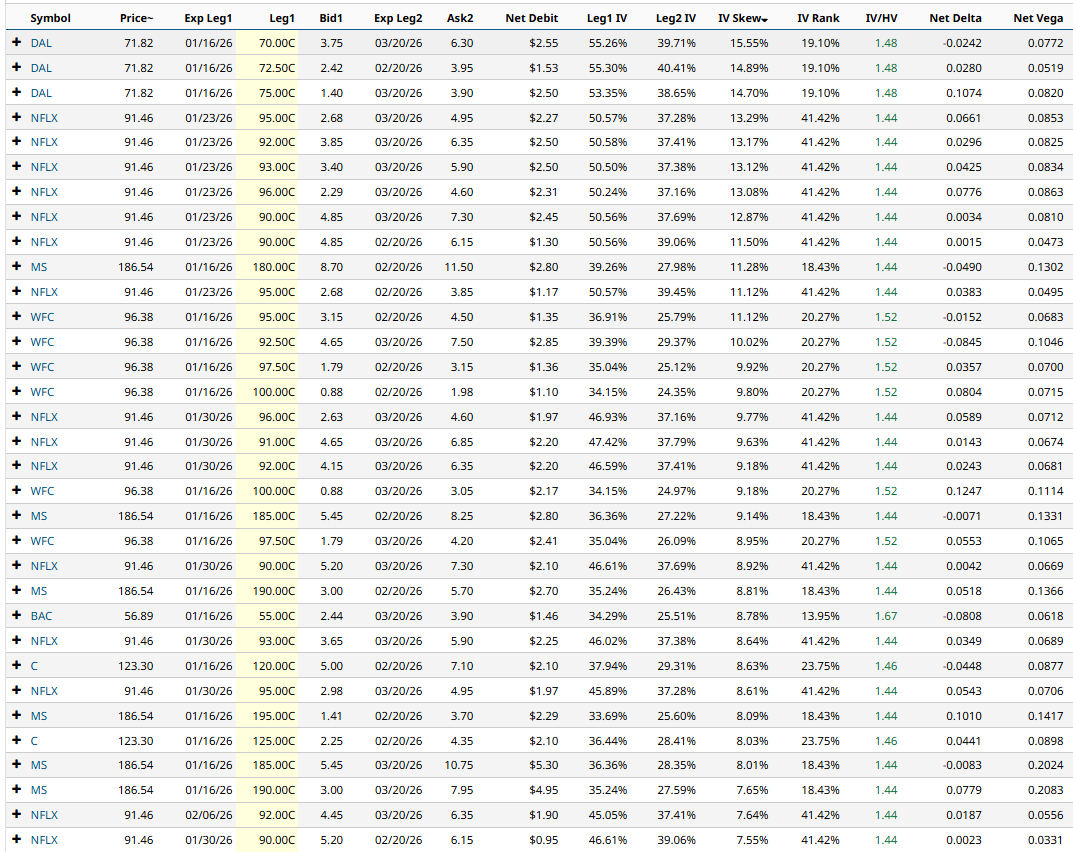
The screener shows some interesting calendar spread trades on popular stocks such as DAL, NFLX, MS, WFC and BAC. Let’s walk through a couple of examples.
Delta Airlines Calendar Spread Example
Let’s use the first line item as an example.
With Delta Airlines stock trading at $71.82, setting up a calendar spread at $70 gives the trade a neutral to slightly bearish outlook.
Selling the January 16 call option with a strike price of $70 and buying the March 20, $70-strike call will cost around $2.55. That is also the most the trade can lose.
The estimated maximum profit is $230, but that could vary depending on changes in implied volatility.
The idea with the trade is that if Delta Airlines stock remains trades around $70 for the next few days, the sold option will decay faster than the bought option allowing the trade to be closed for a profit.
The breakeven prices for the trade are estimated at around $64.75 and $76.75, but these can also change slightly depending on changes in implied volatility.
In terms of trade management if Delta stock broke through either $65 or $77, I would look to adjust or close the trade.
Let’s look at another example.
Netflix Calendar Spread Example
With Netflix stock trading at $91.46, traders could sell the $95-strike January 23 call and buy the $95-strike March 20 call.
That results in a net cost for the trade of $227 per spread, and that is the most the trade can lose.
The estimated maximum profit is $360, but that could vary depending on changes in implied volatility.
The breakeven prices for the trade are estimated at around $86.50 and $107 but these can also change slightly depending on changes in implied volatility.
Wells Fargo Calendar Spread Example
The last example we will look at is on Wells Fargo stock.
With Wells Fargo stock trading at $96.36, traders could sell the $95-strike January 16 call and buy the $95-strike February 20 call.
That results in a net cost for the trade of $135 per spread, and that is the most the trade can lose.
The estimated maximum profit is $200, but that could vary depending on changes in implied volatility.
The breakeven prices for the trade are estimated at around $90 and $101 but these can also change slightly depending on changes in implied volatility.
Mitigating Risk
Thankfully, calendar spreads are risk defined trades, so they have some build in risk management. Position sizing is crucial to ensure that minimal damage is done if the trade suffers a full loss.
One way to set a stop loss for a calendar spread is close the trade if the loss is 20-30% of the premium paid.
Calendar spreads can also contain early assignment risk, so be mindful of that if the stock breaks through the short strike and it’s getting close to expiry.
Please remember that options are risky, and investors can lose 100% of their investment.
This article is for education purposes only and not a trade recommendation. Remember to always do your own due diligence and consult your financial advisor before making any investment decisions.
On the date of publication, Gavin McMaster did not have (either directly or indirectly) positions in any of the securities mentioned in this article. All information and data in this article is solely for informational purposes. For more information please view the Barchart Disclosure Policy here.
More news from Barchart