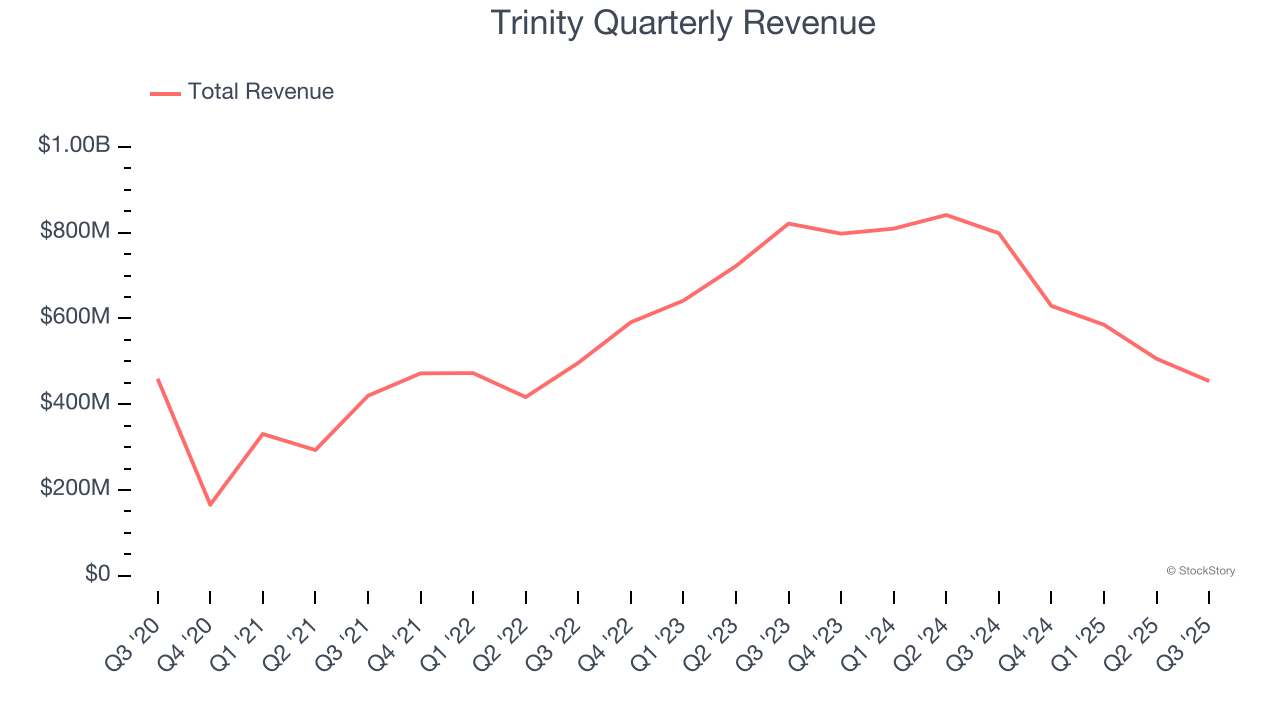
Railcar products and services provider Trinity (NYSE: TRN) fell short of the markets revenue expectations in Q3 CY2025, with sales falling 43.2% year on year to $454.1 million. Its GAAP profit of $0.37 per share was 5.7% above analysts’ consensus estimates.
Is now the time to buy Trinity? Find out by accessing our full research report, it’s free for active Edge members.
Trinity (TRN) Q3 CY2025 Highlights:
- Revenue: $454.1 million vs analyst estimates of $532.7 million (43.2% year-on-year decline, 14.7% miss)
- EPS (GAAP): $0.37 vs analyst estimates of $0.35 (5.7% beat)
- Adjusted EBITDA: $197.4 million vs analyst estimates of $187 million (43.5% margin, 5.6% beat)
- EPS (GAAP) guidance for the full year is $1.63 at the midpoint, beating analyst estimates by 16.1%
- Operating Margin: 26.1%, up from 13.6% in the same quarter last year
- Free Cash Flow was -$199.3 million compared to -$45.4 million in the same quarter last year
- Market Capitalization: $2.25 billion
“Trinity’s third quarter results highlight our Company’s agility and the strength of our business model to deliver favorable performance across all segments of the business,” said Trinity’s Chief Executive Officer and President, Jean Savage.
Company Overview
Operating under the trade name TrinityRail, Trinity (NYSE: TRN) is a provider of railcar products and services in North America.
Revenue Growth
Examining a company’s long-term performance can provide clues about its quality. Any business can have short-term success, but a top-tier one grows for years. Over the last five years, Trinity’s demand was weak and its revenue declined by 2.2% per year. This wasn’t a great result and is a sign of poor business quality.
We at StockStory place the most emphasis on long-term growth, but within industrials, a half-decade historical view may miss cycles, industry trends, or a company capitalizing on catalysts such as a new contract win or a successful product line. Trinity’s recent performance shows its demand remained suppressed as its revenue has declined by 11.5% annually over the last two years. Trinity isn’t alone in its struggles as the Heavy Transportation Equipment industry experienced a cyclical downturn, with many similar businesses observing lower sales at this time. 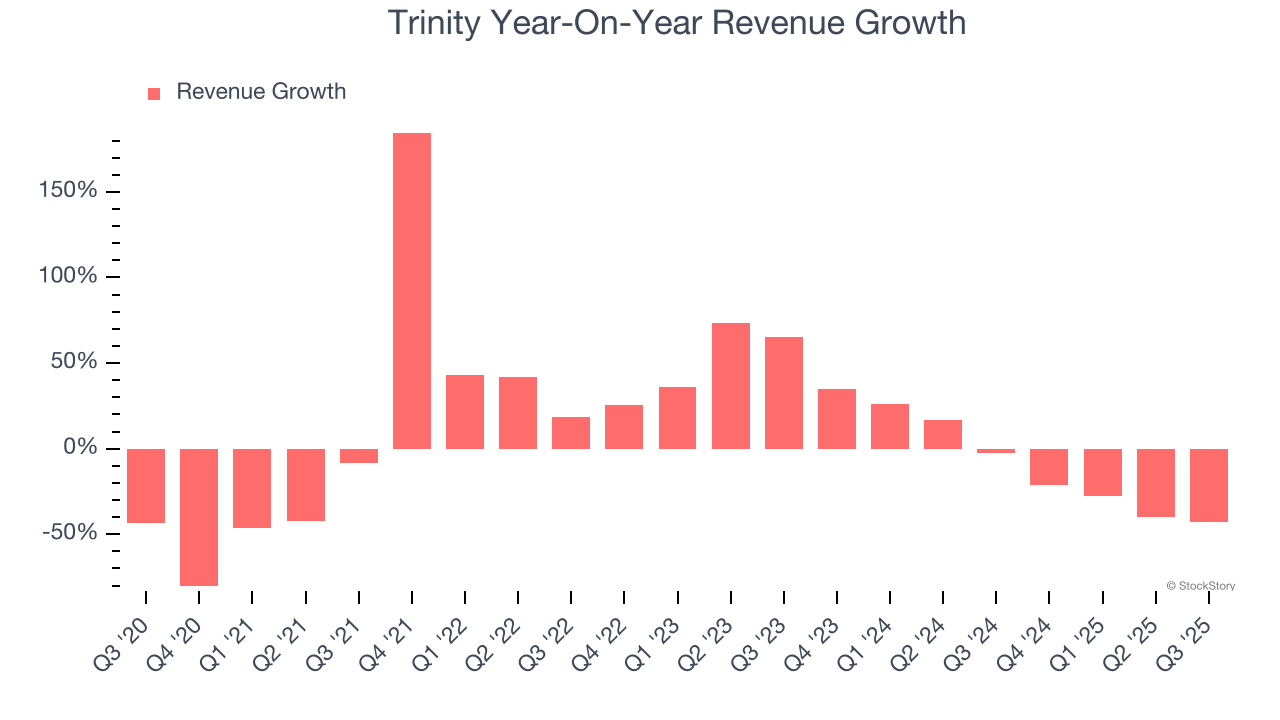
This quarter, Trinity missed Wall Street’s estimates and reported a rather uninspiring 43.2% year-on-year revenue decline, generating $454.1 million of revenue.
Looking ahead, sell-side analysts expect revenue to remain flat over the next 12 months. While this projection indicates its newer products and services will spur better top-line performance, it is still below average for the sector.
Unless you’ve been living under a rock, it should be obvious by now that generative AI is going to have a huge impact on how large corporations do business. While Nvidia and AMD are trading close to all-time highs, we prefer a lesser-known (but still profitable) stock benefiting from the rise of AI. Click here to access our free report one of our favorites growth stories.
Operating Margin
Operating margin is an important measure of profitability as it shows the portion of revenue left after accounting for all core expenses – everything from the cost of goods sold to advertising and wages. It’s also useful for comparing profitability across companies with different levels of debt and tax rates because it excludes interest and taxes.
Trinity has been an efficient company over the last five years. It was one of the more profitable businesses in the industrials sector, boasting an average operating margin of 12.8%. This result was particularly impressive because of its low gross margin, which is mostly a factor of what it sells and takes huge shifts to move meaningfully. Companies have more control over their operating margins, and it’s a show of well-managed operations if they’re high when gross margins are low.
Analyzing the trend in its profitability, Trinity’s operating margin rose by 5 percentage points over the last five years, showing its efficiency has meaningfully improved.
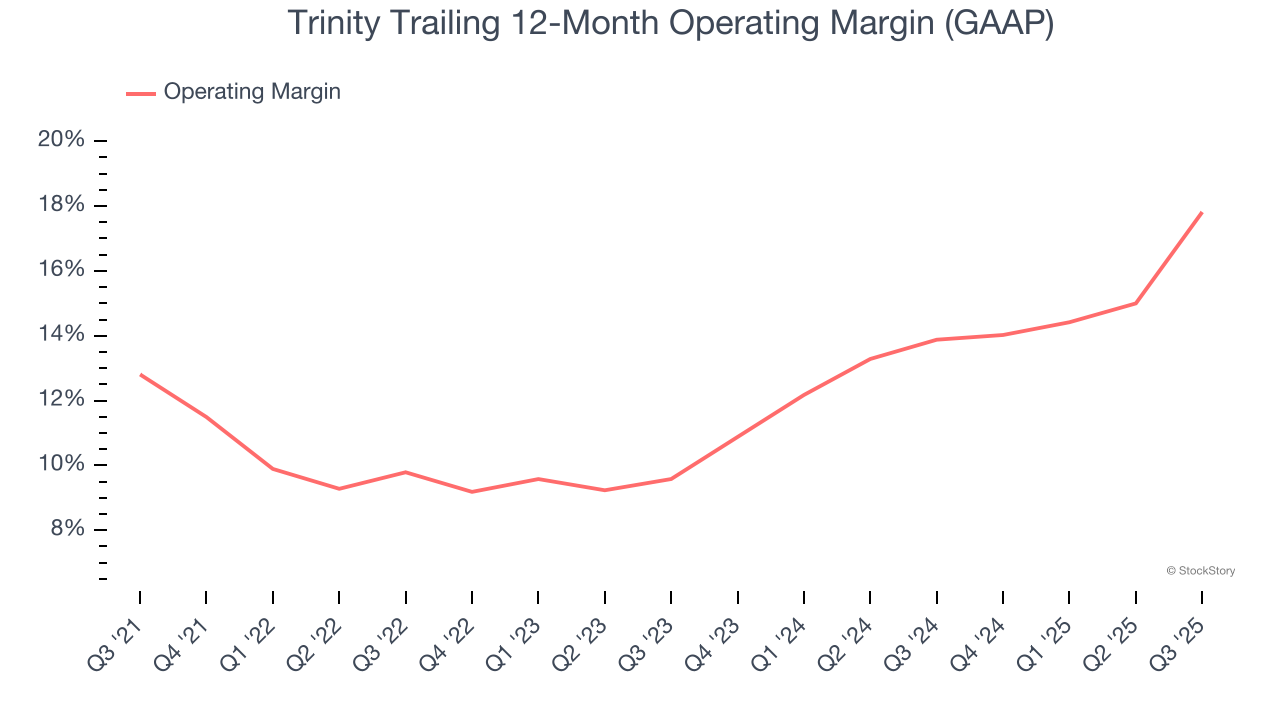
This quarter, Trinity generated an operating margin profit margin of 26.1%, up 12.5 percentage points year on year. The increase was solid, and because its operating margin rose more than its gross margin, we can infer it was more efficient with expenses such as marketing, R&D, and administrative overhead.
Earnings Per Share
We track the long-term change in earnings per share (EPS) for the same reason as long-term revenue growth. Compared to revenue, however, EPS highlights whether a company’s growth is profitable.
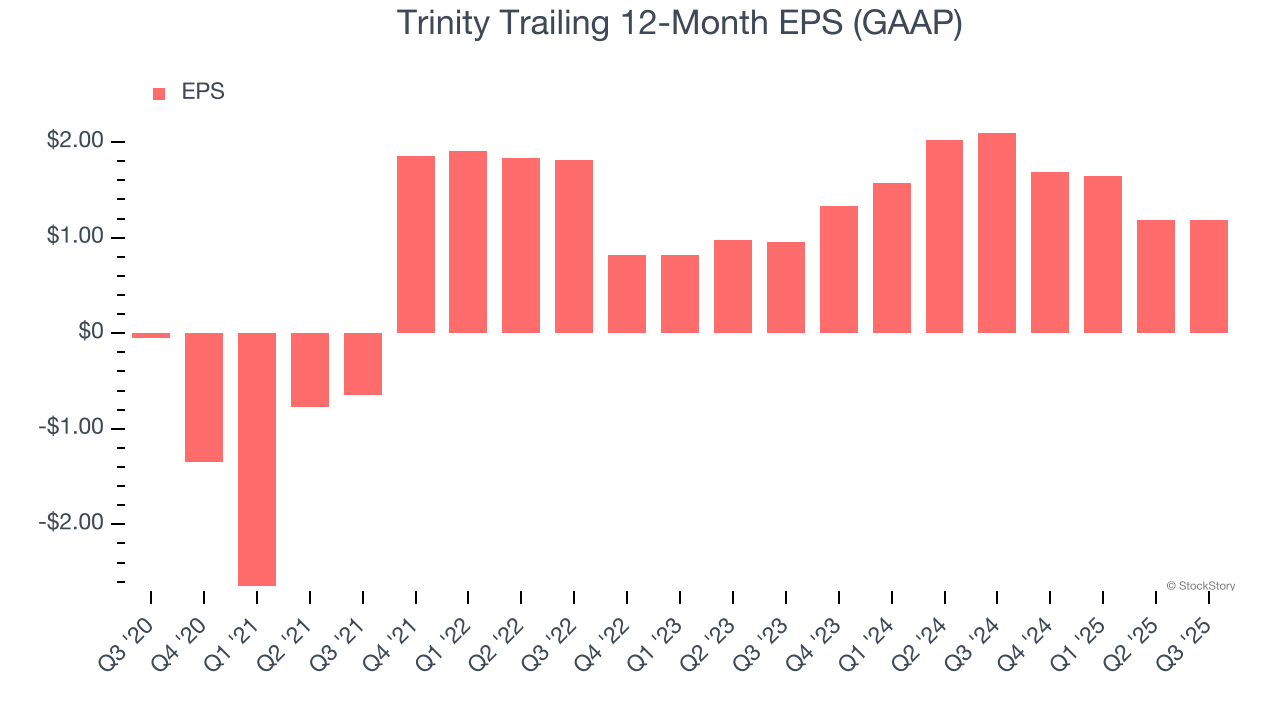
Trinity’s full-year EPS flipped from negative to positive over the last five years. This is encouraging and shows it’s at a critical moment in its life.
Like with revenue, we analyze EPS over a shorter period to see if we are missing a change in the business.
Trinity’s EPS grew at a solid 11.3% compounded annual growth rate over the last two years, higher than its 11.5% annualized revenue declines. This tells us management adapted its cost structure in response to a challenging demand environment.
We can take a deeper look into Trinity’s earnings to better understand the drivers of its performance. Trinity’s operating margin has expanded over the last two yearswhile its share count has shrunk 1.9%. Improving profitability and share buybacks are positive signs for shareholders as they juice EPS growth relative to revenue growth. 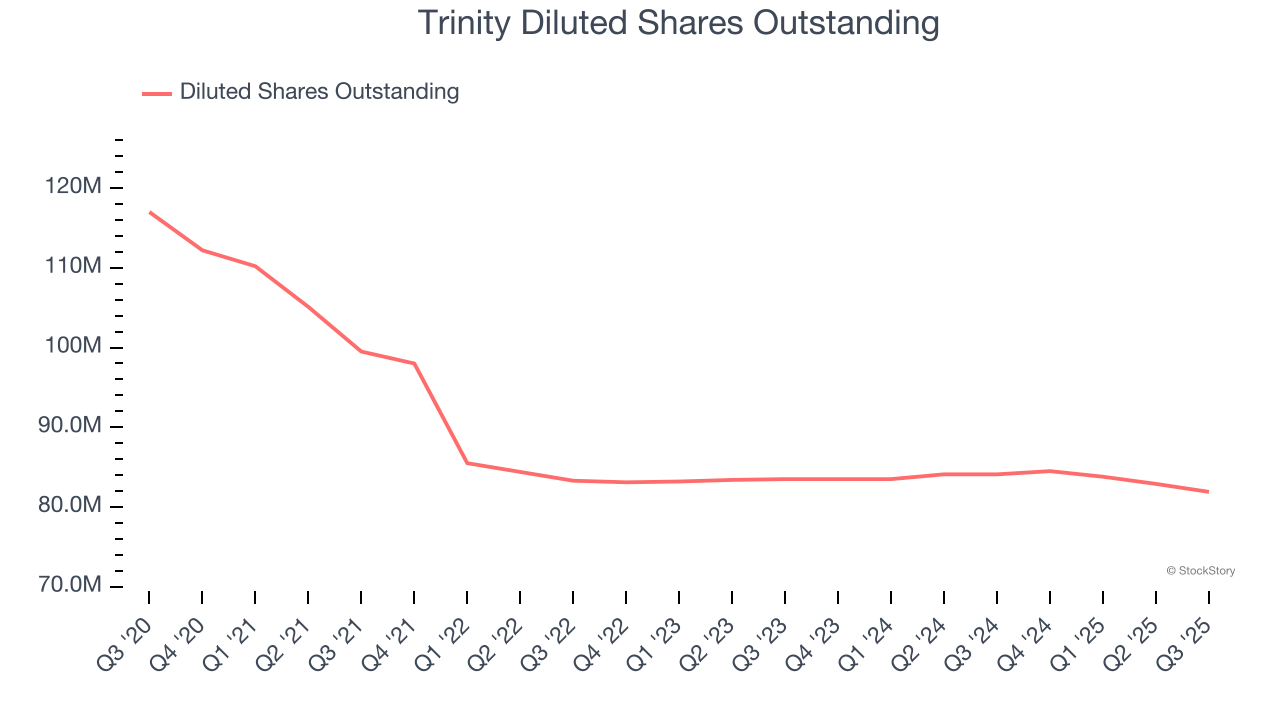
In Q3, Trinity reported EPS of $0.37, in line with the same quarter last year. This print beat analysts’ estimates by 5.7%. We also like to analyze expected EPS growth based on Wall Street analysts’ consensus projections, but there is insufficient data.
Key Takeaways from Trinity’s Q3 Results
We were impressed by Trinity’s optimistic full-year EPS guidance, which blew past analysts’ expectations. We were also glad its EBITDA outperformed Wall Street’s estimates. On the other hand, its revenue missed. Overall, this print was mixed. The stock remained flat at $27.83 immediately after reporting.
Trinity put up rock-solid earnings, but one quarter doesn’t necessarily make the stock a buy. Let’s see if this is a good investment. What happened in the latest quarter matters, but not as much as longer-term business quality and valuation, when deciding whether to invest in this stock. We cover that in our actionable full research report which you can read here, it’s free for active Edge members.