
Real estate data provider CoStar Group (NASDAQ: CSGP) reported revenue ahead of Wall Street’s expectations in Q2 CY2025, with sales up 15.3% year on year to $781.3 million. The company expects next quarter’s revenue to be around $802.5 million, close to analysts’ estimates. Its non-GAAP profit of $0.17 per share was 23.4% above analysts’ consensus estimates.
Is now the time to buy CoStar? Find out by accessing our full research report, it’s free.
CoStar (CSGP) Q2 CY2025 Highlights:
- Revenue: $781.3 million vs analyst estimates of $772.2 million (15.3% year-on-year growth, 1.2% beat)
- Adjusted EPS: $0.17 vs analyst estimates of $0.14 (23.4% beat)
- Adjusted EBITDA: $85 million vs analyst estimates of $59.36 million (10.9% margin, 43.2% beat)
- The company slightly lifted its revenue guidance for the full year to $3.15 billion at the midpoint from $3.14 billion
- Adjusted EPS guidance for the full year is $0.78 at the midpoint, missing analyst estimates by 5%
- EBITDA guidance for the full year is $380 million at the midpoint, below analyst estimates of $383.5 million
- Operating Margin: -3.5%, down from -2.4% in the same quarter last year
- Free Cash Flow was -$5 million compared to -$42.6 million in the same quarter last year
- Market Capitalization: $35.86 billion
Company Overview
With a research department that makes over 10,000 property updates daily to its 35-year-old database, CoStar Group (NASDAQ: CSGP) provides comprehensive real estate data, analytics, and online marketplaces for commercial and residential properties in the U.S. and U.K.
Revenue Growth
Reviewing a company’s long-term sales performance reveals insights into its quality. Any business can put up a good quarter or two, but many enduring ones grow for years.
With $2.92 billion in revenue over the past 12 months, CoStar is a mid-sized business services company, which sometimes brings disadvantages compared to larger competitors benefiting from better economies of scale. On the bright side, it can still flex high growth rates because it’s working from a smaller revenue base.
As you can see below, CoStar’s sales grew at an exceptional 14% compounded annual growth rate over the last five years. This shows it had high demand, a useful starting point for our analysis.
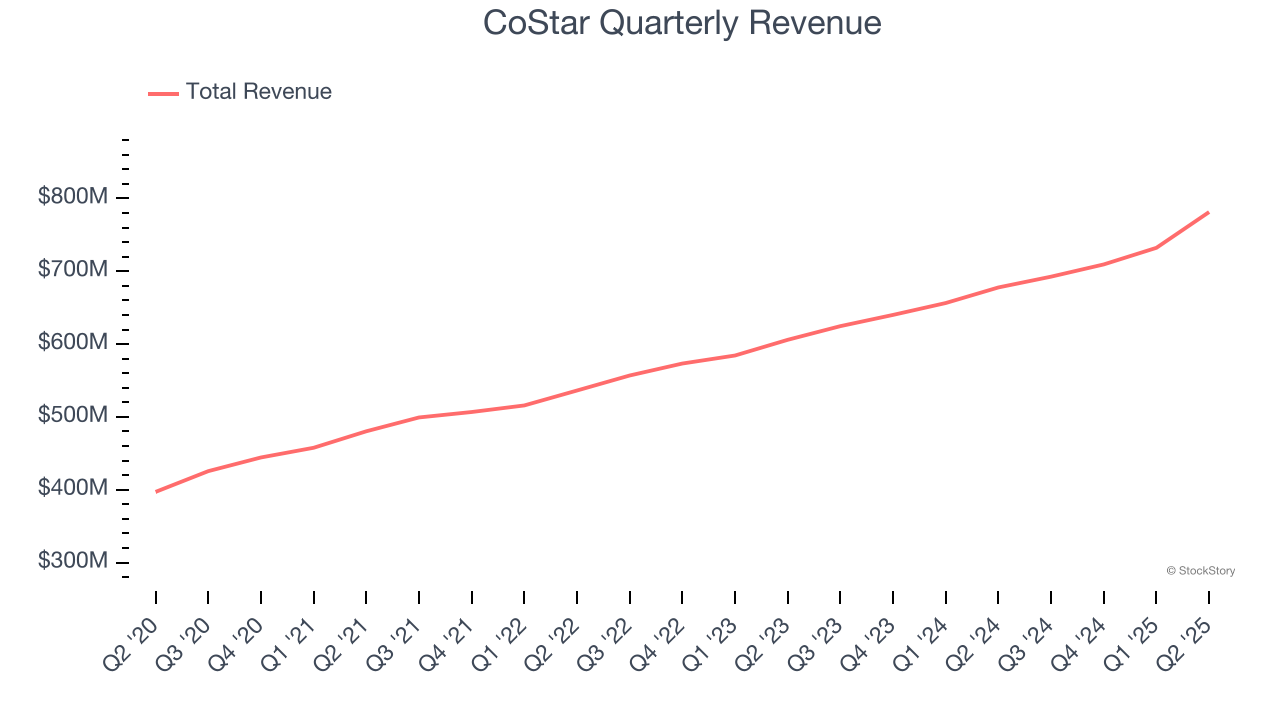
We at StockStory place the most emphasis on long-term growth, but within business services, a half-decade historical view may miss recent innovations or disruptive industry trends. CoStar’s annualized revenue growth of 12.1% over the last two years is below its five-year trend, but we still think the results suggest healthy demand. 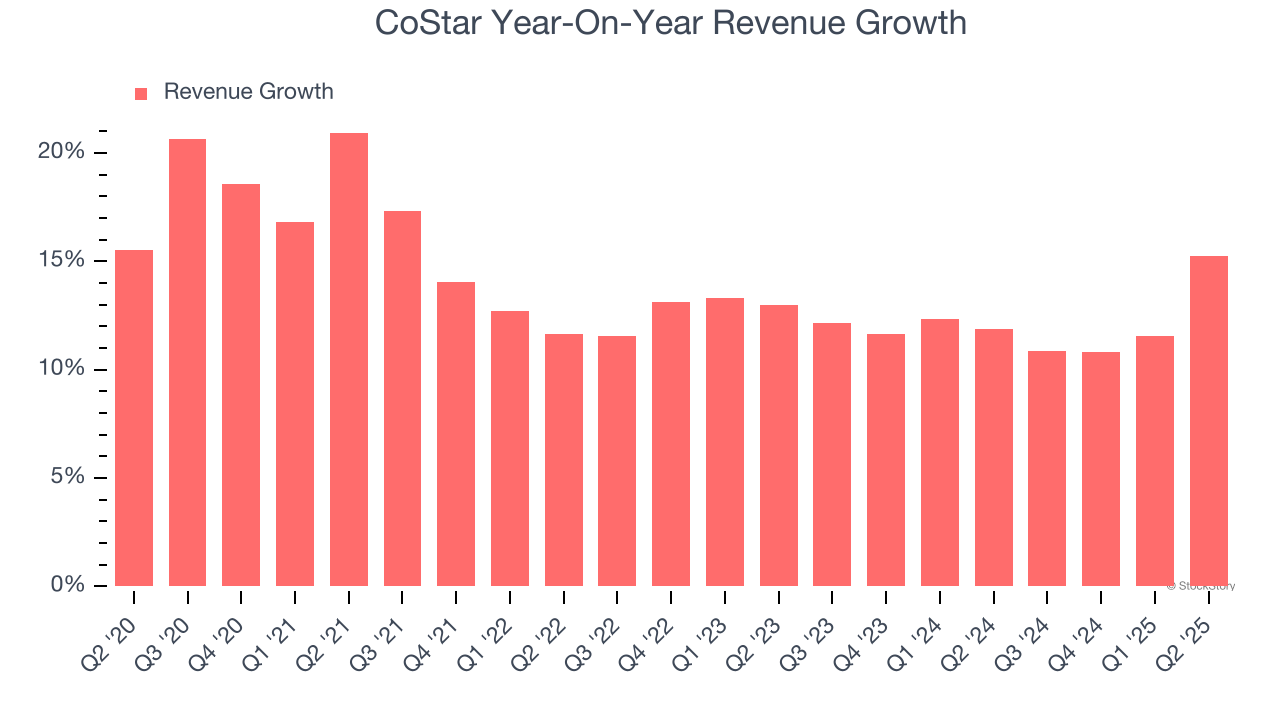
This quarter, CoStar reported year-on-year revenue growth of 15.3%, and its $781.3 million of revenue exceeded Wall Street’s estimates by 1.2%. Company management is currently guiding for a 15.9% year-on-year increase in sales next quarter.
Looking further ahead, sell-side analysts expect revenue to grow 13.8% over the next 12 months, an improvement versus the last two years. This projection is healthy and implies its newer products and services will catalyze better top-line performance.
Unless you’ve been living under a rock, it should be obvious by now that generative AI is going to have a huge impact on how large corporations do business. While Nvidia and AMD are trading close to all-time highs, we prefer a lesser-known (but still profitable) stock benefiting from the rise of AI. Click here to access our free report one of our favorites growth stories.
Operating Margin
CoStar has done a decent job managing its cost base over the last five years. The company has produced an average operating margin of 10.5%, higher than the broader business services sector.
Analyzing the trend in its profitability, CoStar’s operating margin decreased by 18.7 percentage points over the last five years. This raises questions about the company’s expense base because its revenue growth should have given it leverage on its fixed costs, resulting in better economies of scale and profitability.
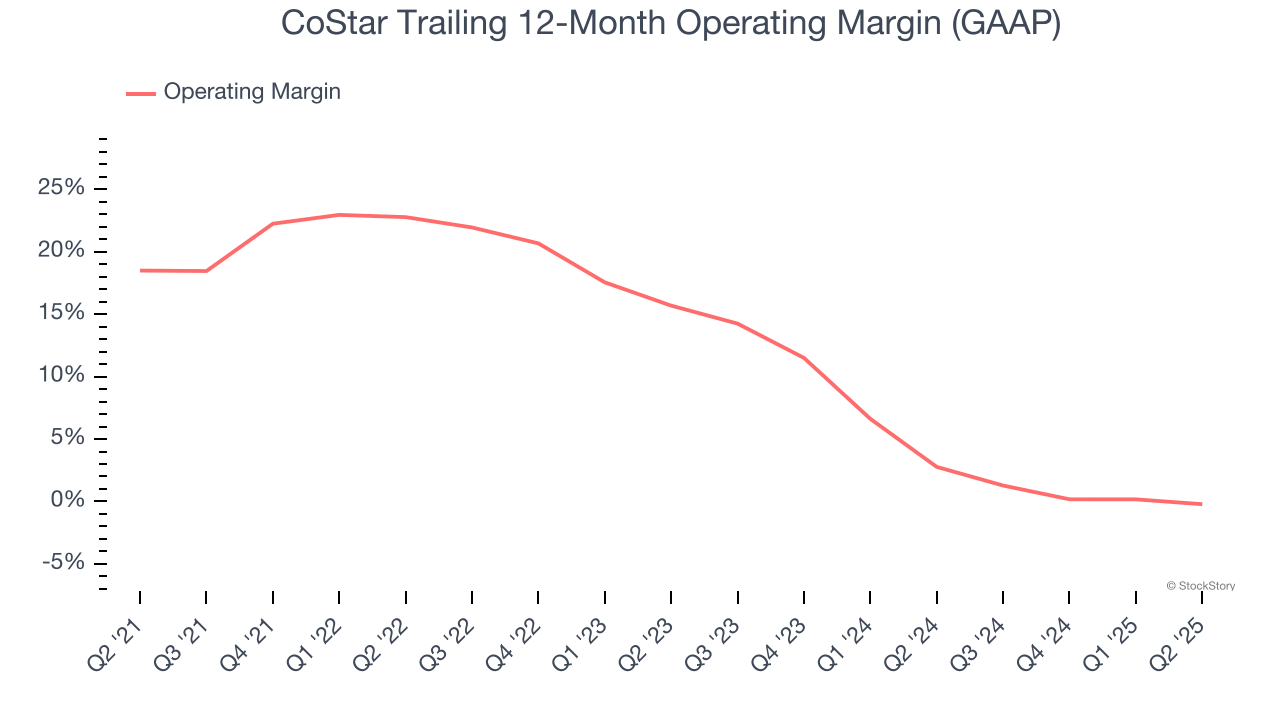
In Q2, CoStar generated an operating margin profit margin of negative 3.5%, down 1.1 percentage points year on year. This reduction is quite minuscule and indicates the company’s overall cost structure has been relatively stable.
Earnings Per Share
Revenue trends explain a company’s historical growth, but the long-term change in earnings per share (EPS) points to the profitability of that growth – for example, a company could inflate its sales through excessive spending on advertising and promotions.
Sadly for CoStar, its EPS declined by 3.7% annually over the last five years while its revenue grew by 14%. This tells us the company became less profitable on a per-share basis as it expanded.
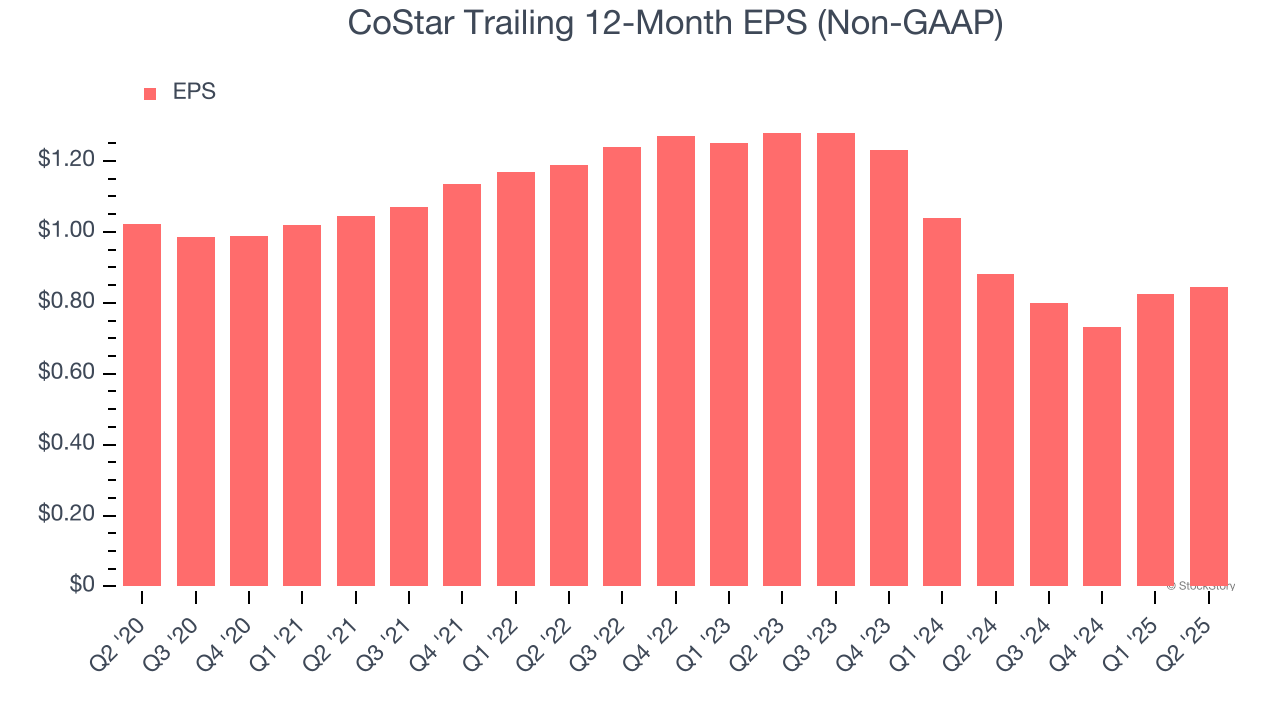
We can take a deeper look into CoStar’s earnings to better understand the drivers of its performance. As we mentioned earlier, CoStar’s operating margin declined by 18.7 percentage points over the last five years. Its share count also grew by 12.4%, meaning the company not only became less efficient with its operating expenses but also diluted its shareholders. 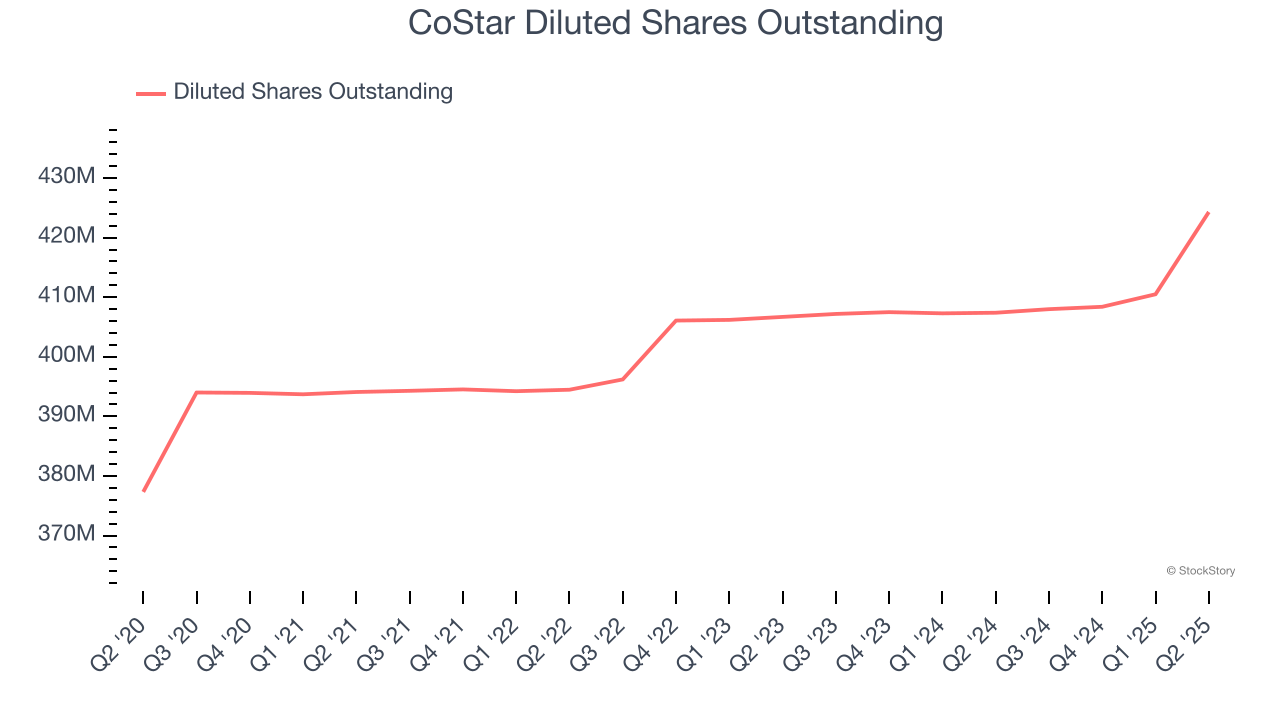
Like with revenue, we analyze EPS over a shorter period to see if we are missing a change in the business.
For CoStar, its two-year annual EPS declines of 18.8% show it’s continued to underperform. These results were bad no matter how you slice the data.
In Q2, CoStar reported EPS at $0.17, up from $0.15 in the same quarter last year. This print easily cleared analysts’ estimates, and shareholders should be content with the results. Over the next 12 months, Wall Street expects CoStar’s full-year EPS of $0.84 to grow 27.1%.
Key Takeaways from CoStar’s Q2 Results
We were impressed by how significantly CoStar blew past analysts’ revenue, EPS, and EBITDA expectations this quarter. We were also happy it slightly raised its full-year revenue guidance. On the other hand, its full-year EPS and EBITDA guidance fell short of Wall Street’s estimates. Overall, this quarter was mixed. The stock traded up 1.1% to $86 immediately following the results.
So do we think CoStar is an attractive buy at the current price? When making that decision, it’s important to consider its valuation, business qualities, as well as what has happened in the latest quarter. We cover that in our actionable full research report which you can read here, it’s free.


