Over the past six months, Stryker’s shares (currently trading at $277.82) have posted a disappointing 20% loss, well below the S&P 500’s 12.8% gain. This may have investors wondering how to approach the situation.
Following the pullback, is now a good time to buy SYK? Find out in our full research report, it’s free.
Why Do Investors Watch Stryker?
With over 150 million patients impacted annually through its innovative healthcare technologies, Stryker (NYSE: SYK) develops and manufactures advanced medical devices and equipment across orthopedics, surgical tools, neurotechnology, and patient care solutions.
Three Positive Attributes:
1. Organic Growth Indicates Solid Core Business
We can better understand Medical Devices & Supplies - Diversified companies by analyzing their organic revenue. This metric gives visibility into Stryker’s core business because it excludes one-time events such as mergers, acquisitions, and divestitures along with foreign currency fluctuations - non-fundamental factors that can manipulate the income statement.
Over the last two years, Stryker’s organic revenue averaged 9.2% year-on-year growth. This performance was solid and shows it can expand steadily without relying on expensive (and risky) acquisitions. 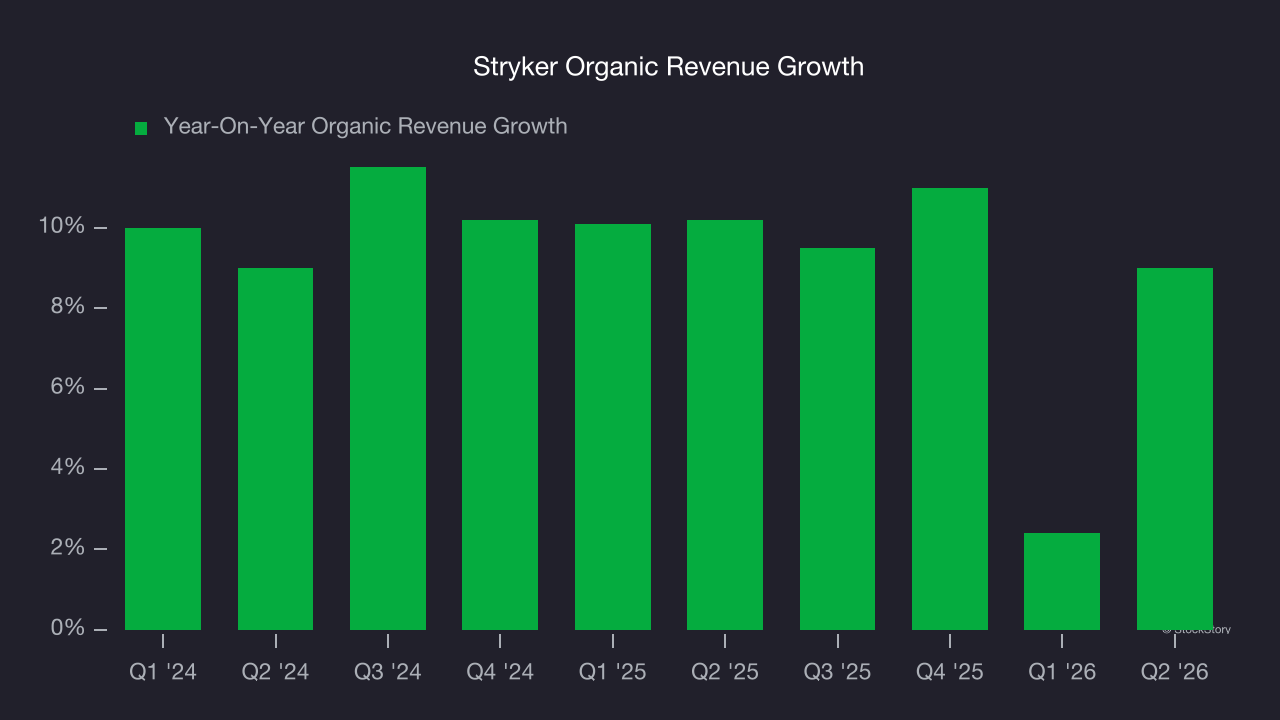
2. Economies of Scale Give It Negotiating Leverage with Suppliers
Larger companies benefit from economies of scale, where fixed costs like infrastructure, technology, and administration are spread over a higher volume of goods or services, reducing the cost per unit. Scale can also lead to bargaining power with suppliers, greater brand recognition, and more investment firepower. A virtuous cycle can ensue if a scaled company plays its cards right.
With $25.84 billion in revenue over the past 12 months, Stryker sports economies of scale. This is important as it gives the company more leverage in a heavily regulated, competitive environment that is complex and resource-intensive.
3. Increasing Free Cash Flow Margin Juices Financials
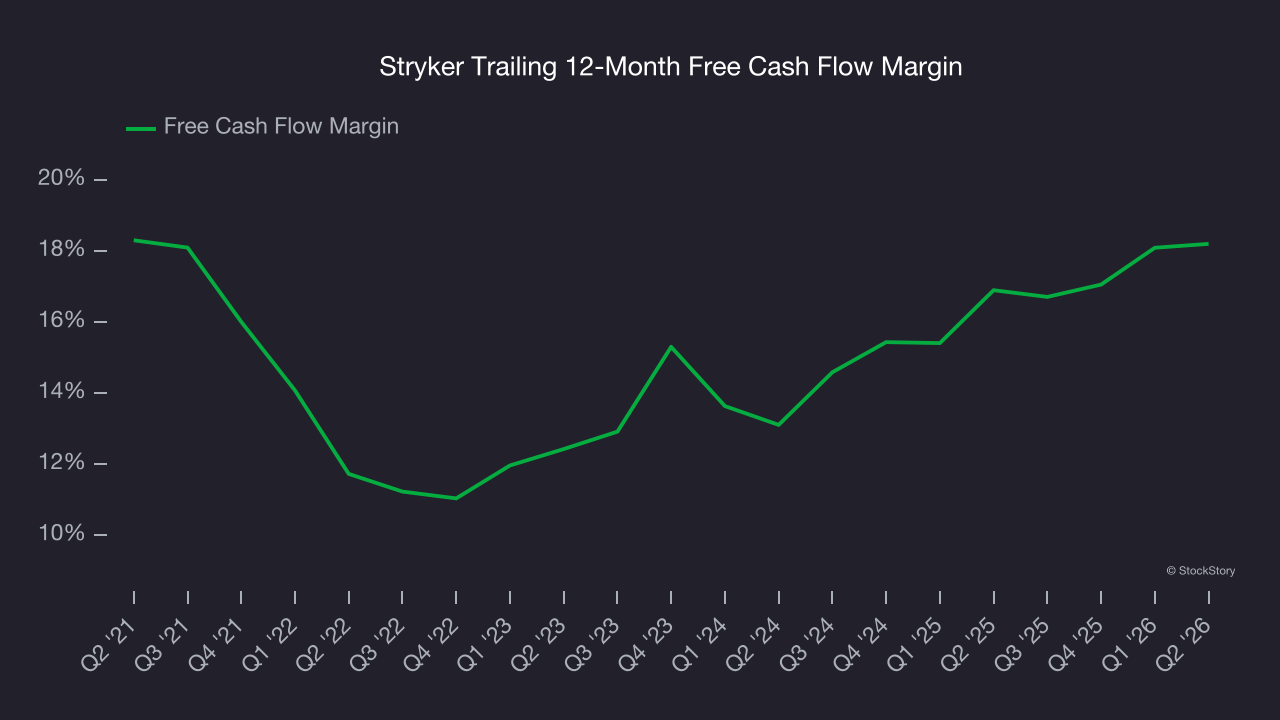
Free cash flow isn’t a prominently featured metric in company financials and earnings releases, but we think it’s telling because it accounts for all operating and capital expenses, making it tough to manipulate. Cash is king.
As you can see below, Stryker’s margin expanded by 6.5 percentage points over the last five years. This is encouraging, and we can see it became a less capital-intensive business because its free cash flow profitability rose more than its operating profitability. Stryker’s free cash flow margin for the trailing 12 months was 18.2%.
Final Judgment
There are definitely things to like about Stryker. After the recent drawdown, the stock trades at 17.4× forward P/E (or $277.82 per share). Is now the right time to buy? See for yourself in our comprehensive research report, it’s free.
High-Quality Stocks for All Market Conditions
WHILE YOU’RE HERE: Top 9 Market-Beating Stocks. The best stocks don’t just beat the market once. They do it again. And again. Robust revenue growth, rising free cash flow, returns on capital that leave their competition in the dust. The market has already rewarded these businesses.
But our AI platform says the party isn’t over. Find out which 9 stocks made the cut this week — FREE. Get Our Top 9 Market-Beating Stocks for Free HERE.
Stocks that have made our list include now familiar names such as Nvidia (+1,460% between June 2020 and June 2025) as well as under-the-radar businesses like the once-micro-cap company Tecnoglass (+1,552% between June 2020 and June 2025). Find your next big winner with StockStory today.