ProFrac’s stock price has taken a beating over the past six months, shedding 21.6% of its value and falling to $4.88 per share. This might have investors contemplating their next move.
Is now the time to buy ProFrac, or should you be careful about including it in your portfolio? Dive into our full research report to see our analyst team’s opinion, it’s free.
Why Do We Think ProFrac Will Underperform?
Even though the stock has become cheaper, we’re passing on ProFrac for now. Here are three reasons why ACDC doesn’t excite us, plus one stock we’d rather own.
1. Low Gross Margin Reveals Weak Structural Profitability
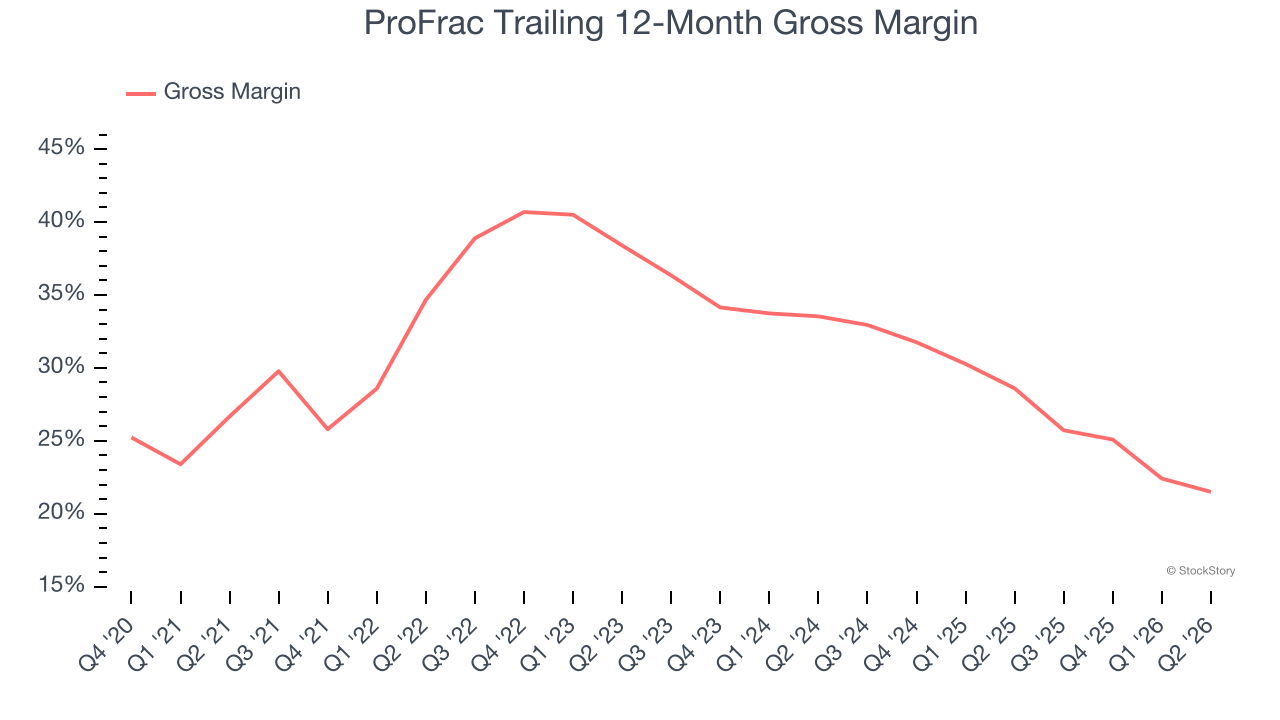
In a single quarter or year, gross margins in the sector can swing wildly due to commodity prices, hedging, or changes in labor costs. Over a multi-year period across different points in the cycle, gross margin differences can signal whether a company is a structurally-advantaged producer (“rock” quality, takeaway, operating costs) or not.
ProFrac, which averaged 32.1% gross margin over the last five years, exhibited bottom-tier unit economics in the sector. It means the company will struggle at higher commodity prices than peers with better gross margins.
2. Shrinking EBITDA Margin
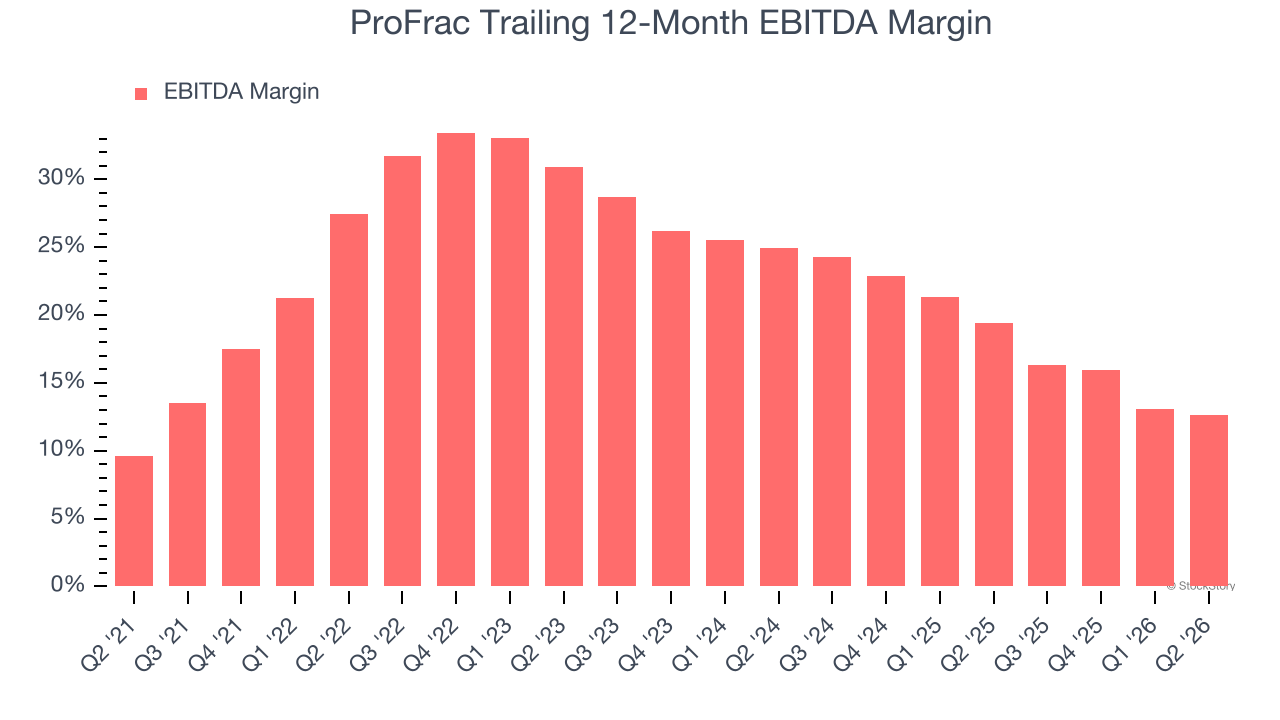
Adjusted EBITDA margin captures the true operating profitability of an energy producer by removing accounting noise around depletion and capitalized drilling costs. It reveals how much cash the asset base generates before capital structure and reinvestment requirements shape reported earnings.
Looking at the trend in its profitability, ProFrac’s EBITDA margin decreased by 14.9 percentage points over the last year. ProFrac’s performance was poor no matter how you look at it - it shows that costs were rising and it couldn’t pass them onto its customers. Its EBITDA margin for the trailing 12 months was 12.6%.
3. Mediocre Free Cash Flow Margin Limits Reinvestment Potential
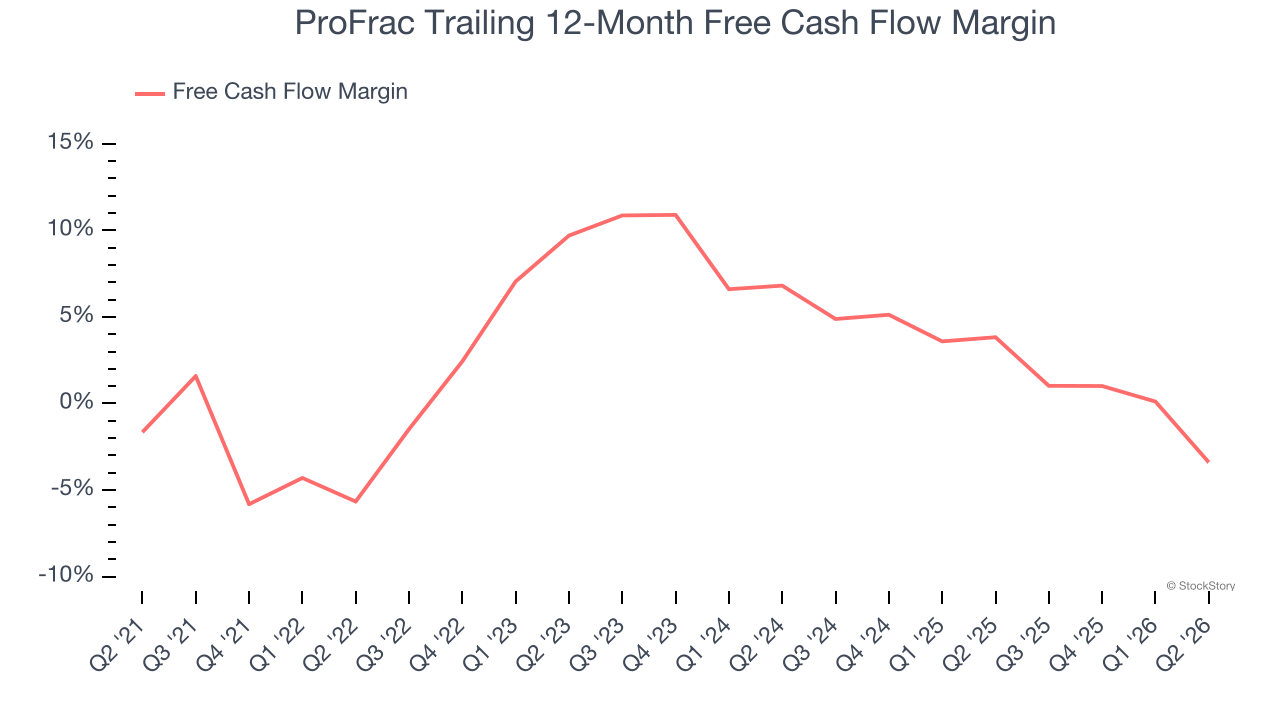
If you’ve followed StockStory for a while, you know we emphasize free cash flow. Why, you ask? We believe that in the end, cash is king, and you can’t use accounting profits to pay the bills.
ProFrac has shown weak cash profitability relative to peers over the last five years, giving the company fewer opportunities to return capital to shareholders. Its free cash flow margin averaged 3.7%, below what we’d expect for an upstream and integrated energy business.
Final Judgment
ProFrac falls short of our quality standards. Following the recent decline, the stock trades at 6.4× forward EV-to-EBITDA (or $4.88 per share). While this valuation is optically cheap, the potential downside is huge given its shaky fundamentals. There are superior stocks to buy right now. We’d recommend looking at a top digital advertising platform riding the creator economy.
Stocks We Would Buy Instead of ProFrac
WHILE YOU’RE HERE: Top 9 Market-Beating Stocks. The best stocks don’t just beat the market once. They do it again. And again. Robust revenue growth, rising free cash flow, returns on capital that leave their competition in the dust. The market has already rewarded these businesses.
But our AI platform says the party isn’t over. Find out which 9 stocks made the cut this week — FREE. Get Our Top 9 Market-Beating Stocks for Free HERE.
Stocks that have made our list include now familiar names such as Nvidia (+1,460% between June 2020 and June 2025) as well as under-the-radar businesses like the once-micro-cap company Tecnoglass (+1,552% between June 2020 and June 2025). Find your next big winner with StockStory today.