
Media broadcasting company Sinclair (NASDAQ: SBGI) announced better-than-expected revenue in Q1 CY2026, with sales up 4% year on year to $807 million. Its GAAP profit of $0.28 per share was significantly above analysts’ consensus estimates.
Is now the time to buy Sinclair? Find out by accessing our full research report, it’s free.
Sinclair (SBGI) Q1 CY2026 Highlights:
- Revenue: $807 million vs analyst estimates of $791.5 million (4% year-on-year growth, 2% beat)
- EPS (GAAP): $0.28 vs analyst estimates of -$1.04 (significant beat)
- Adjusted EBITDA: $126 million vs analyst estimates of $103.2 million (15.6% margin, 22.1% beat)
- Operating Margin: 3.3%, up from 1.8% in the same quarter last year
- Market Capitalization: $1.10 billion
Company Overview
With over 2,400 hours of local news produced weekly and 640 broadcast channels reaching millions of American homes, Sinclair (NASDAQ: SBGI) operates a network of 185 local television stations across 86 U.S. markets, producing news programming and distributing content from major networks.
Revenue Growth
Examining a company’s long-term performance can provide clues about its quality. Any business can experience short-term success, but top-performing ones enjoy sustained growth for years.
With $3.2 billion in revenue over the past 12 months, Sinclair is a mid-sized business services company, which sometimes brings disadvantages compared to larger competitors benefiting from better economies of scale.
As you can see below, Sinclair’s revenue declined by 11.4% per year over the last five years, a tough starting point for our analysis.
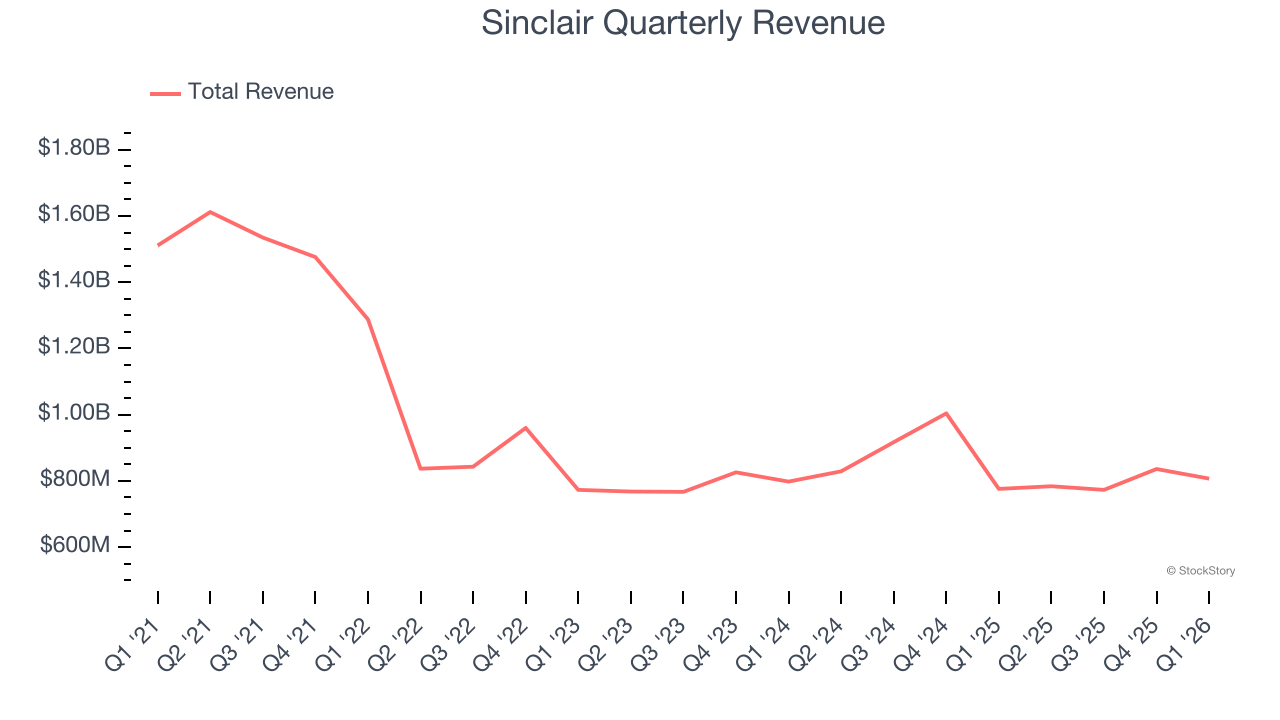
Long-term growth is the most important, but within business services, a half-decade historical view may miss new innovations or demand cycles. Sinclair’s revenue over the last two years was flat, sugggesting its demand was weak but stabilized after its initial drop. 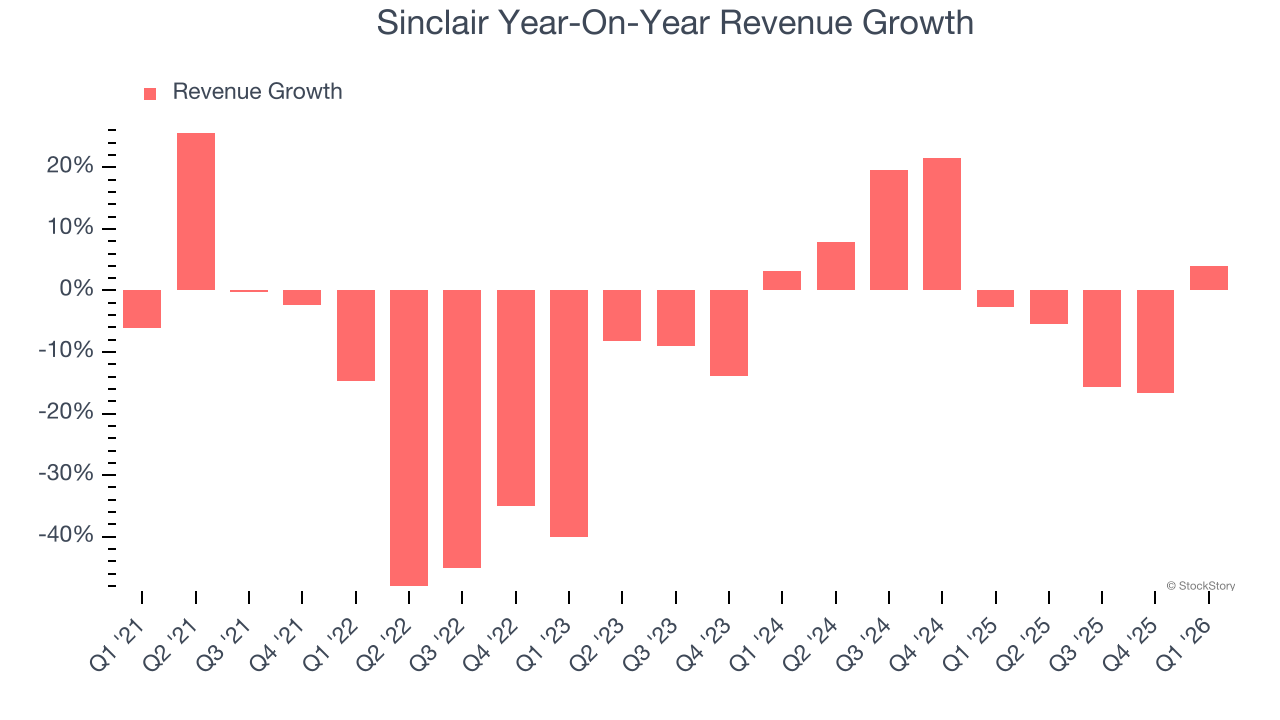
Sinclair also breaks out the revenue for its most important segments, Distribution and Advertising, which are 37.8% and 56.8% of revenue. Over the last two years, Sinclair’s Distribution revenue (content distribution) averaged 12.6% year-on-year growth while its Advertising revenue (advertising sales) averaged 15.5% growth. 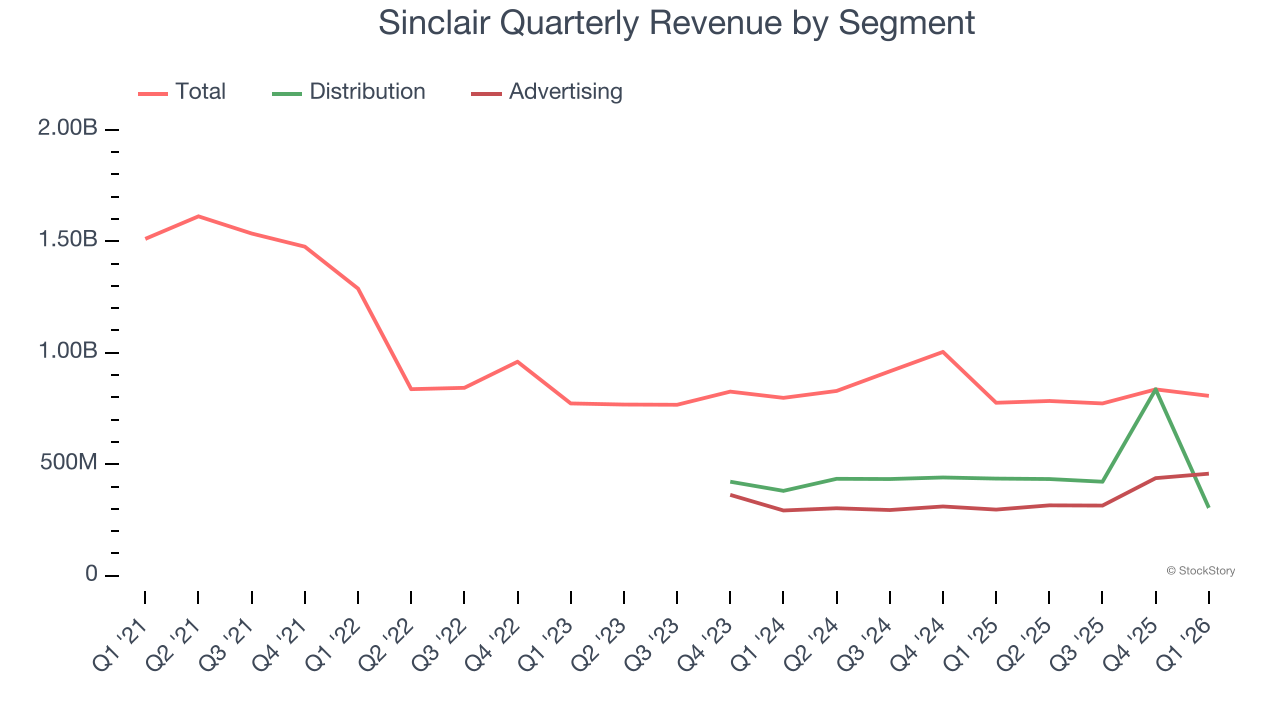
This quarter, Sinclair reported modest year-on-year revenue growth of 4% but beat Wall Street’s estimates by 2%.
Looking ahead, sell-side analysts expect revenue to grow 8.8% over the next 12 months, an improvement versus the last two years. This projection is healthy and implies its newer products and services will spur better top-line performance.
ONE MORE THING: 3 Hidden Platforms Growing 3X Faster than Amazon, Google, and PayPal. Amazon, Google, and Meta all followed the same playbook: Dominate an ignored market. Build an unbeatable moat. Scale until you’re unstoppable.
These three platforms are running that exact playbook right now. The early investors in Amazon made fortunes. The early investors in these could do the same. Get All 3 Stocks Here for FREE.
Adjusted Operating Margin
Adjusted operating margin is a key measure of profitability. Think of it as net income (the bottom line) excluding the impact of non-recurring expenses, taxes, and interest on debt - metrics less connected to business fundamentals.
Sinclair has been a well-oiled machine over the last five years. It demonstrated elite profitability for a business services business, boasting an average adjusted operating margin of 23.3%.
Analyzing the trend in its profitability, Sinclair’s adjusted operating margin decreased by 53.2 percentage points over the last five years. Even though its historical margin was healthy, shareholders will want to see Sinclair become more profitable in the future.
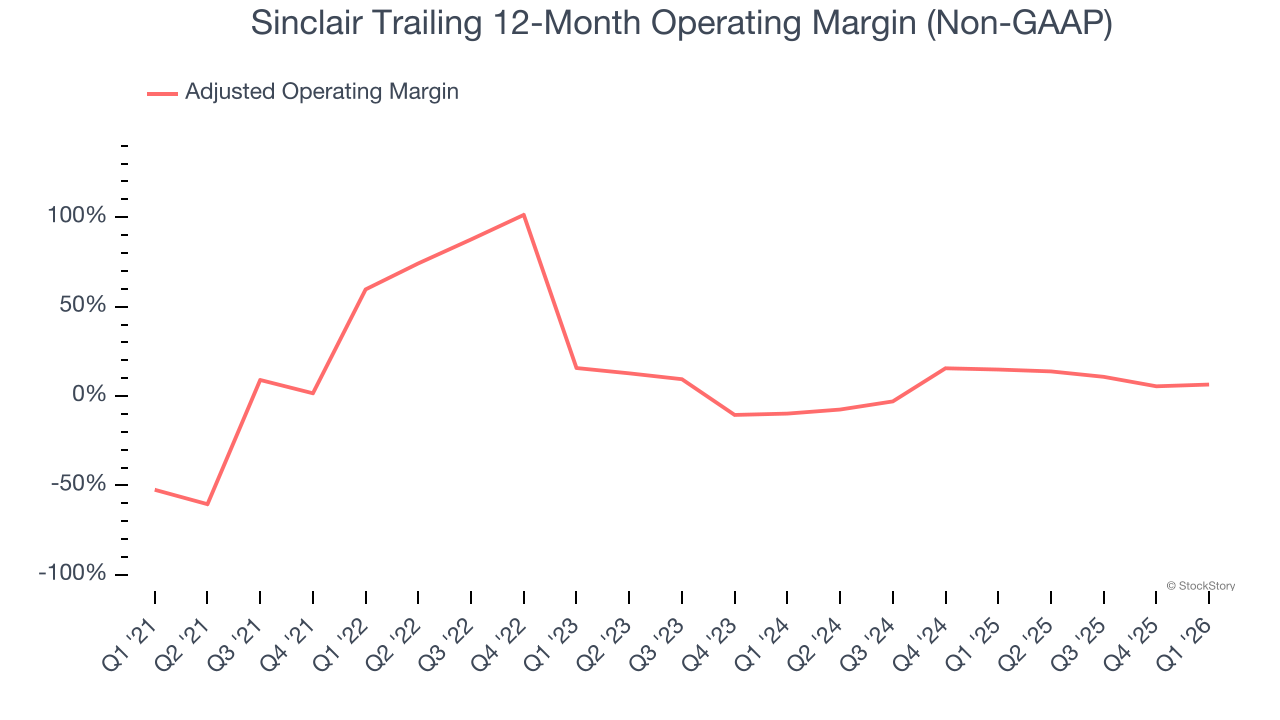
In Q1, Sinclair generated an adjusted operating margin profit margin of 5.8%, up 4 percentage points year on year. This increase was a welcome development and shows it was more efficient.
Earnings Per Share
Revenue trends explain a company’s historical growth, but the long-term change in earnings per share (EPS) points to the profitability of that growth – for example, a company could inflate its sales through excessive spending on advertising and promotions.
Sinclair’s full-year EPS flipped from negative to positive over the last five years. This is encouraging and shows it’s at a critical moment in its life.
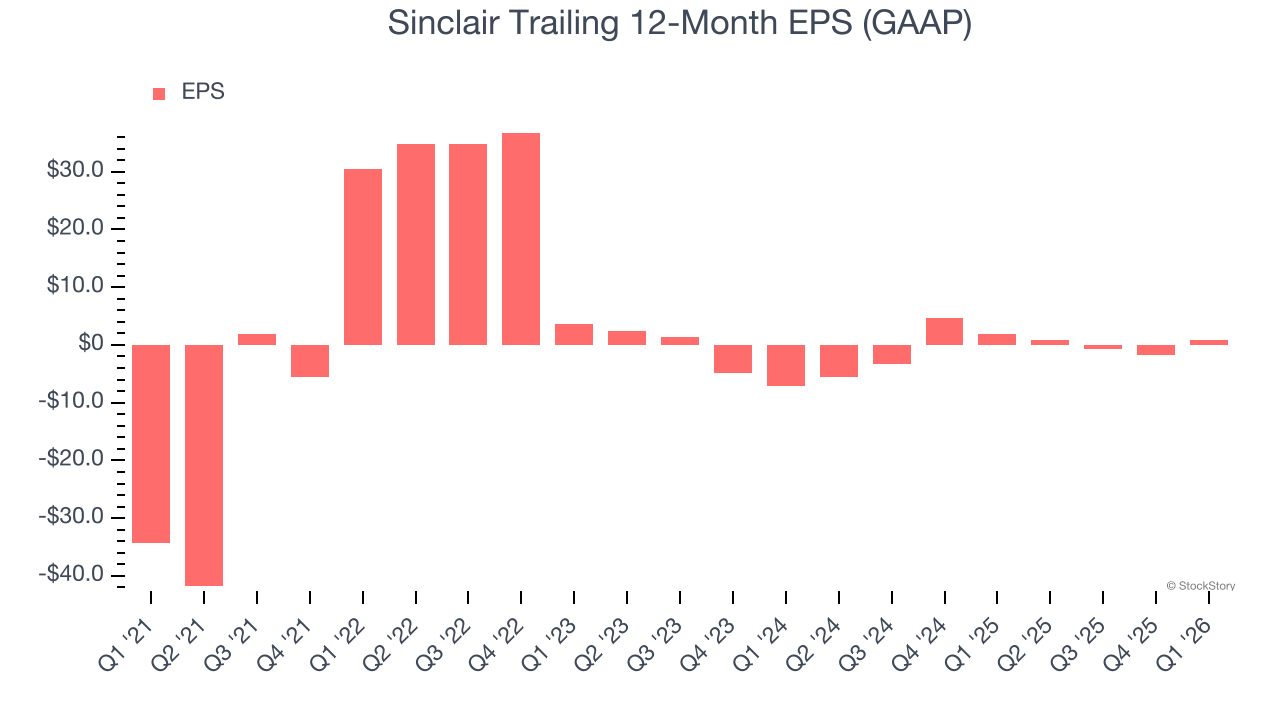
Like with revenue, we analyze EPS over a shorter period to see if we are missing a change in the business.
For Sinclair, its two-year annual EPS growth of 45.8% was higher than its five-year trend. We love it when earnings growth accelerates, especially when it accelerates off an already high base.
In Q1, Sinclair reported EPS of $0.28, up from negative $2.31 in the same quarter last year. This print easily cleared analysts’ estimates, and shareholders should be content with the results. We also like to analyze expected EPS growth based on Wall Street analysts’ consensus projections, but there is insufficient data.
Key Takeaways from Sinclair’s Q1 Results
It was good to see Sinclair beat analysts’ EPS expectations this quarter. We were also happy its revenue outperformed Wall Street’s estimates. Zooming out, we think this was a solid print. The stock traded up 1.5% to $15.80 immediately following the results.
Sure, Sinclair had a solid quarter, but if we look at the bigger picture, is this stock a buy? The latest quarter does matter, but not nearly as much as longer-term fundamentals and valuation, when deciding if the stock is a buy. We cover that in our actionable full research report which you can read here (it’s free).