Aerospace and defense company Cadre (NYSE: CDRE) met Wall Street’s revenue expectations in Q1 CY2026, with sales up 19.5% year on year to $155.4 million. The company’s full-year revenue guidance of $747 million at the midpoint came in 0.9% above analysts’ estimates. Its GAAP profit of $0.05 per share was $0.02 below analysts’ consensus estimates.
Is now the time to buy Cadre? Find out by accessing our full research report, it’s free.
Cadre (CDRE) Q1 CY2026 Highlights:
- Revenue: $155.4 million vs analyst estimates of $155 million (19.5% year-on-year growth, in line)
- EPS (GAAP): $0.05 vs analyst estimates of $0.07 ($0.02 miss)
- Adjusted EBITDA: $21.11 million vs analyst estimates of $19.8 million (13.6% margin, 6.6% beat)
- The company reconfirmed its revenue guidance for the full year of $747 million at the midpoint
- EBITDA guidance for the full year is $138.5 million at the midpoint, above analyst estimates of $134.7 million
- Operating Margin: 4.8%, down from 10.4% in the same quarter last year
- Free Cash Flow Margin: 12.8%, similar to the same quarter last year
- Market Capitalization: $1.28 billion
“Following a year of meaningful financial and strategic progress, we began 2026 with significant momentum and delivered another quarter of strong performance,” said Warren Kanders, CEO and Chairman.
Company Overview
Originally known as Safariland, Cadre (NYSE: CDRE) specializes in manufacturing and distributing safety and survivability equipment for first responders.
Revenue Growth
Reviewing a company’s long-term sales performance reveals insights into its quality. Any business can have short-term success, but a top-tier one grows for years. Over the last five years, Cadre grew its sales at a decent 8.8% compounded annual growth rate. Its growth was slightly above the average industrials company and shows its offerings resonate with customers.
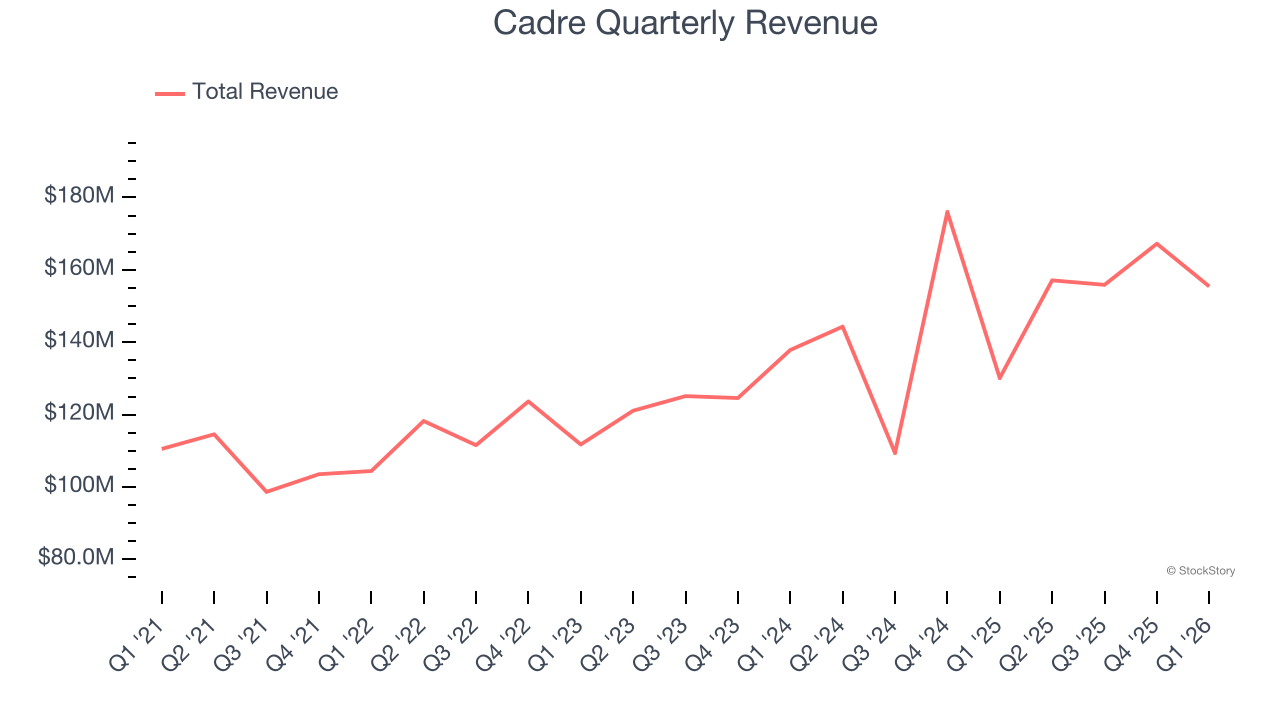
Long-term growth is the most important, but within industrials, a half-decade historical view may miss new industry trends or demand cycles. Cadre’s annualized revenue growth of 11.8% over the last two years is above its five-year trend, suggesting its demand recently accelerated. 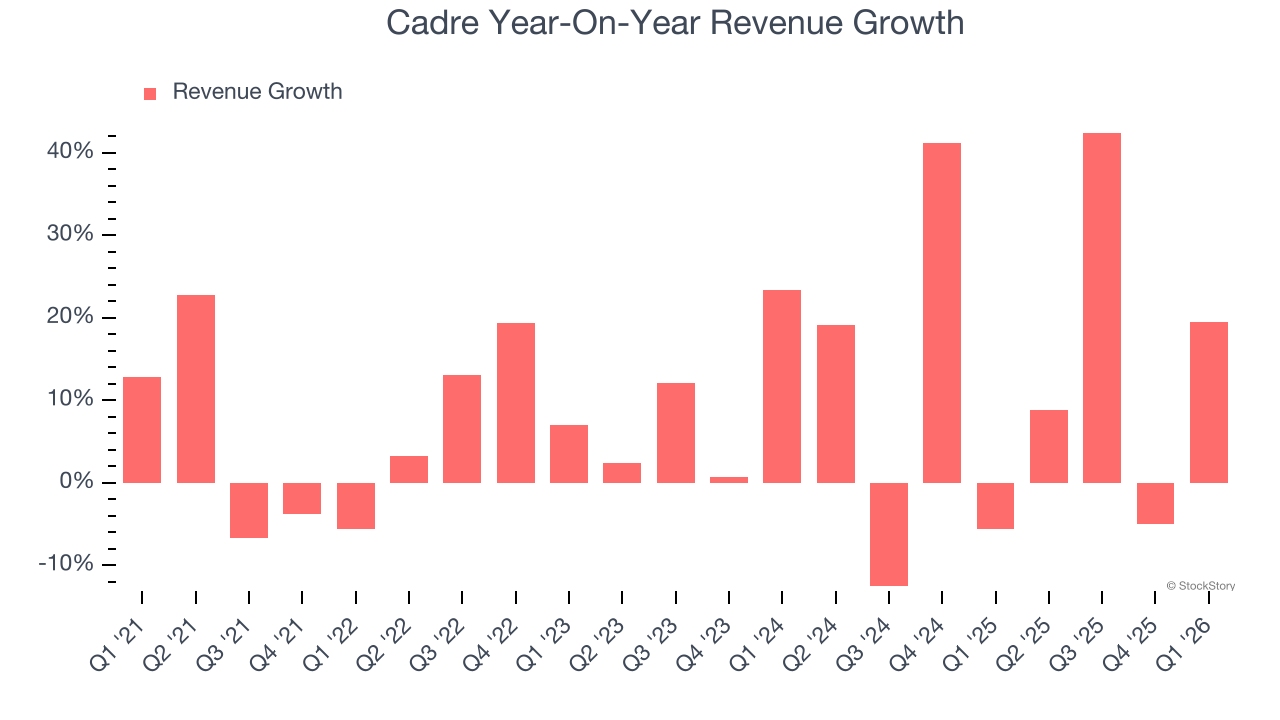
We can dig further into the company’s revenue dynamics by analyzing its most important segment, Products. Over the last two years, Cadre’s Products revenue (body armor, corrections tools, sensors) averaged 19.5% year-on-year growth. This segment has outperformed its total sales during the same period, lifting the company’s performance. 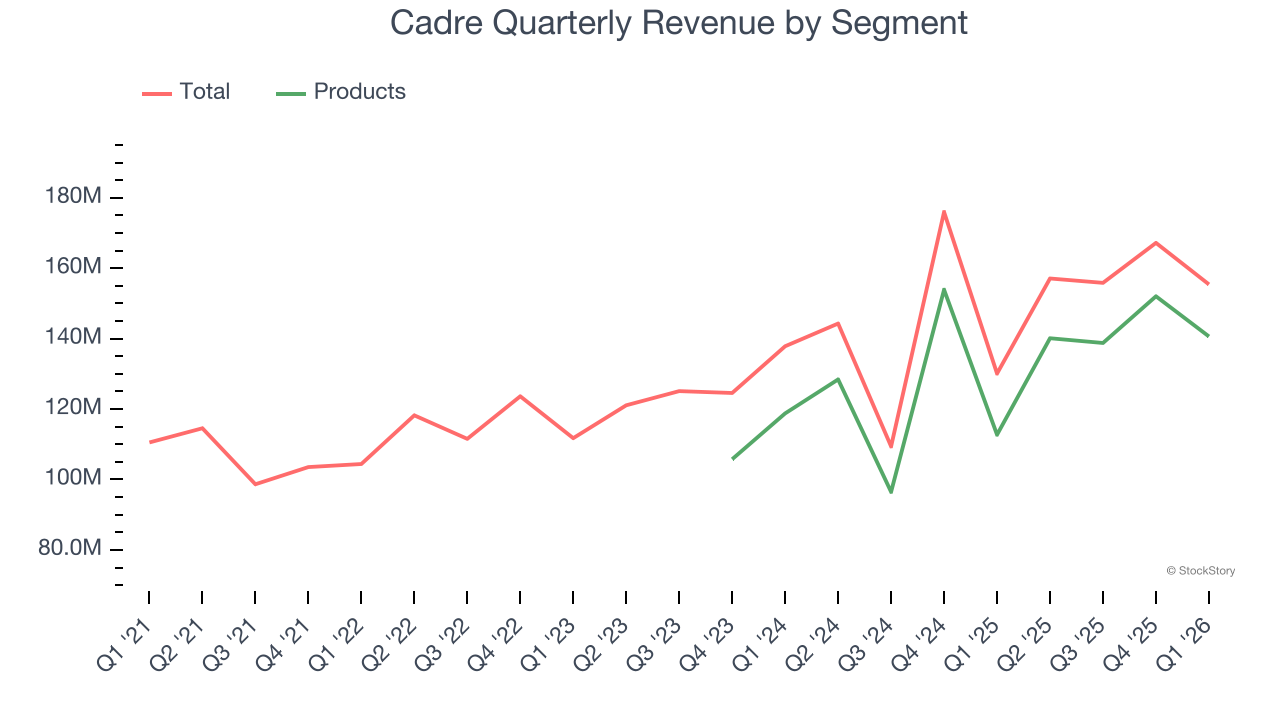
This quarter, Cadre’s year-on-year revenue growth was 19.5%, and its $155.4 million of revenue was in line with Wall Street’s estimates.
Looking ahead, sell-side analysts expect revenue to grow 22.7% over the next 12 months, an improvement versus the last two years. This projection is eye-popping and suggests its newer products and services will fuel better top-line performance.
ONE MORE THING: 3 Hidden Platforms Growing 3X Faster than Amazon, Google, and PayPal. Amazon, Google, and Meta all followed the same playbook: Dominate an ignored market. Build an unbeatable moat. Scale until you’re unstoppable.
These three platforms are running that exact playbook right now. The early investors in Amazon made fortunes. The early investors in these could do the same. Get All 3 Stocks Here for FREE.
Operating Margin
Cadre has done a decent job managing its cost base over the last five years. The company has produced an average operating margin of 9.7%, higher than the broader industrials sector.
Analyzing the trend in its profitability, Cadre’s operating margin rose by 4.5 percentage points over the last five years, as its sales growth gave it operating leverage.
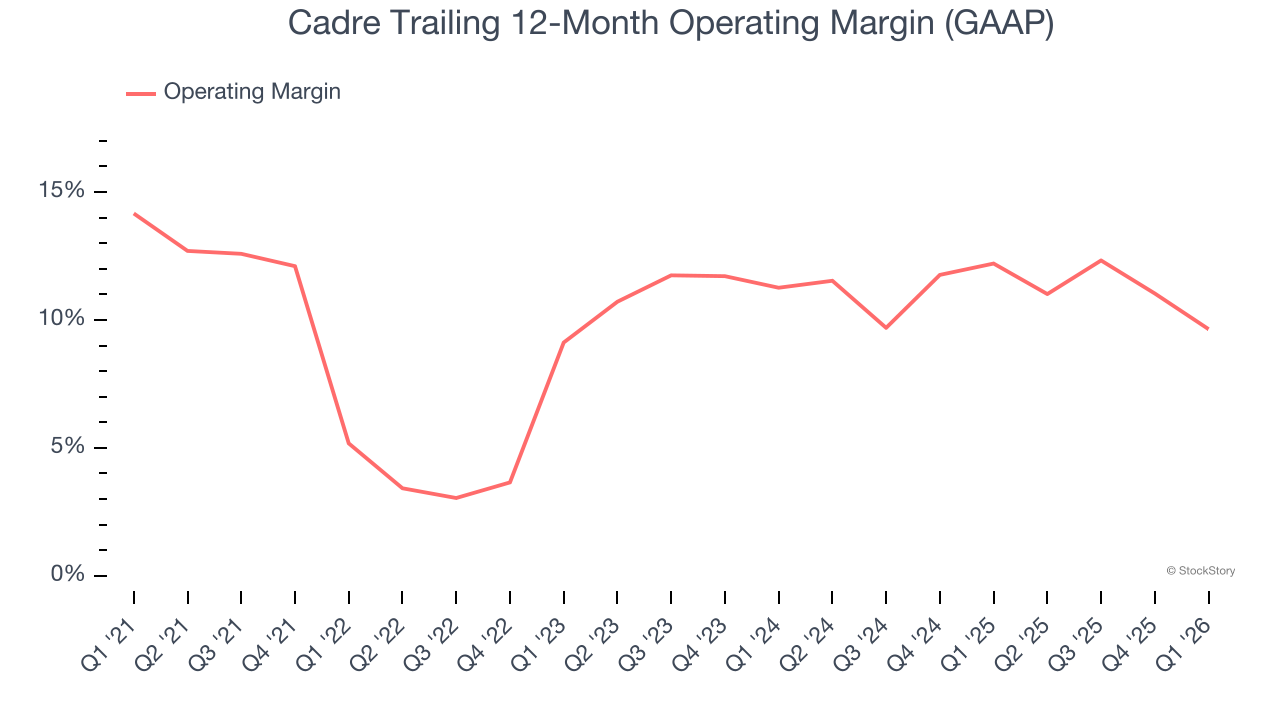
This quarter, Cadre generated an operating margin profit margin of 4.8%, down 5.6 percentage points year on year. This contraction shows it was less efficient because its expenses grew faster than its revenue.
Earnings Per Share
Revenue trends explain a company’s historical growth, but the long-term change in earnings per share (EPS) points to the profitability of that growth – for example, a company could inflate its sales through excessive spending on advertising and promotions.
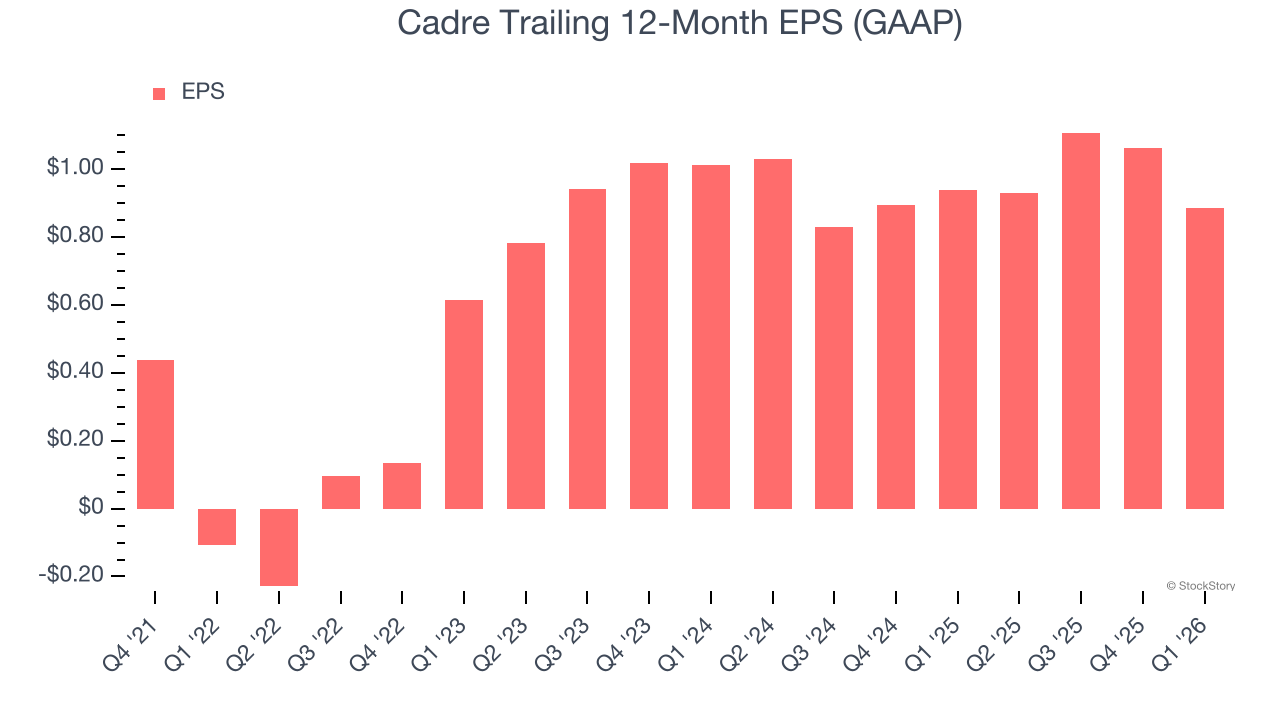
Cadre’s full-year EPS flipped from negative to positive over the last four years. This is a good sign and shows it’s at an inflection point.
Like with revenue, we analyze EPS over a shorter period to see if we are missing a change in the business.
Sadly for Cadre, its EPS declined by 6.5% annually over the last two years while its revenue grew by 11.8%. This tells us the company became less profitable on a per-share basis as it expanded.
We can take a deeper look into Cadre’s earnings to better understand the drivers of its performance. Cadre’s operating margin has declined over the last two yearswhile its share count has grown 12.5%. This means the company not only became less efficient with its operating expenses but also diluted its shareholders. 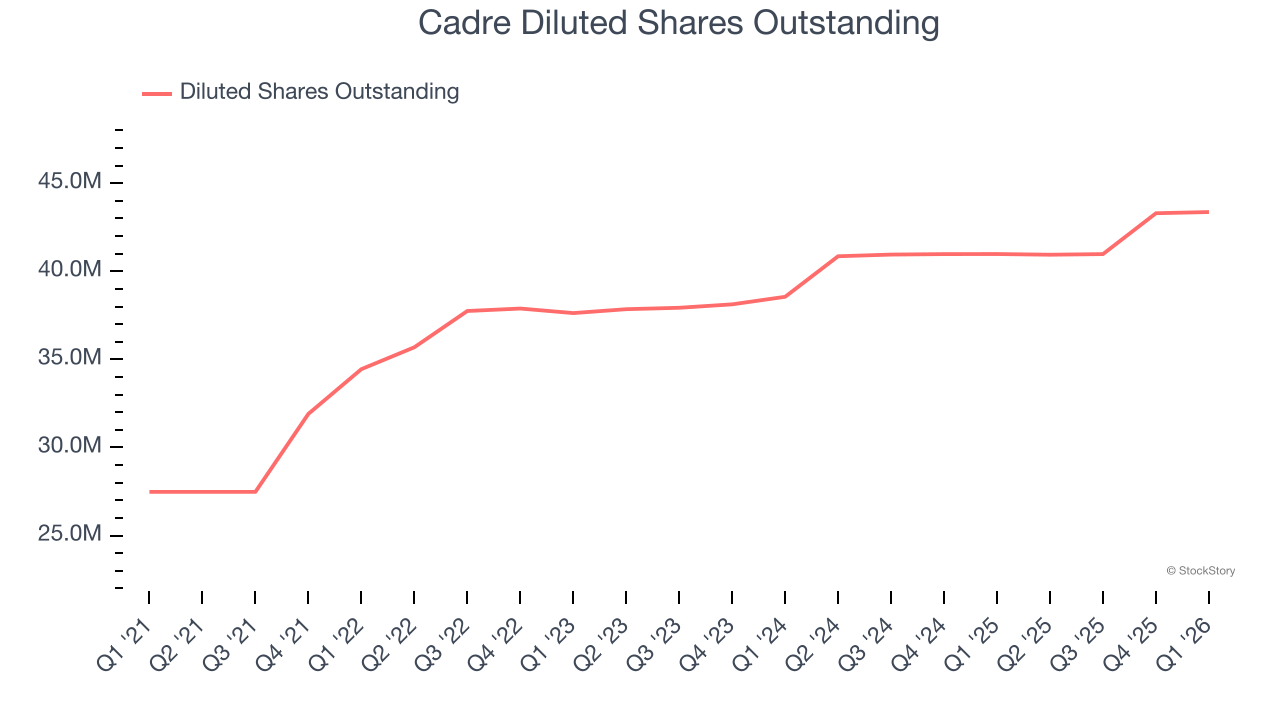
In Q1, Cadre reported EPS of $0.05, down from $0.23 in the same quarter last year. This print missed analysts’ estimates, but we care more about long-term EPS growth than short-term movements. We also like to analyze expected EPS growth based on Wall Street analysts’ consensus projections, but there is insufficient data.
Key Takeaways from Cadre’s Q1 Results
It was great to see Cadre’s full-year EBITDA guidance top analysts’ expectations. We were also glad its EBITDA outperformed Wall Street’s estimates. On the other hand, its EPS was in line. Overall, we think this was still a solid quarter with some key areas of upside. The market seemed to be hoping for more, and the stock traded down 4.6% to $29.98 immediately after reporting.
So do we think Cadre is an attractive buy at the current price? If you’re making that decision, you should consider the bigger picture of valuation, business qualities, as well as the latest earnings. We cover that in our actionable full research report which you can read here (it’s free).