
Installed Building Products’s stock price has taken a beating over the past six months, shedding 24.8% of its value and falling to $245.57 per share. This might have investors contemplating their next move.
Is there a buying opportunity in Installed Building Products, or does it present a risk to your portfolio? Dive into our full research report to see our analyst team’s opinion, it’s free.
Why Is Installed Building Products Not Exciting?
Even though the stock has become cheaper, we’re cautious about Installed Building Products. Here are three reasons why IBP doesn’t excite us, plus one stock we’d rather own.
1. Lackluster Revenue Growth
Long-term growth is the most important, but within industrials, a stretched historical view may miss new industry trends or demand cycles. Installed Building Products’s recent performance shows its demand has slowed significantly as its annualized revenue growth of 1.8% over the last two years was well below its five-year trend. We also note many other Home Builders businesses have faced declining sales because of cyclical headwinds. While Installed Building Products grew slower than we’d like, it did do better than its peers. 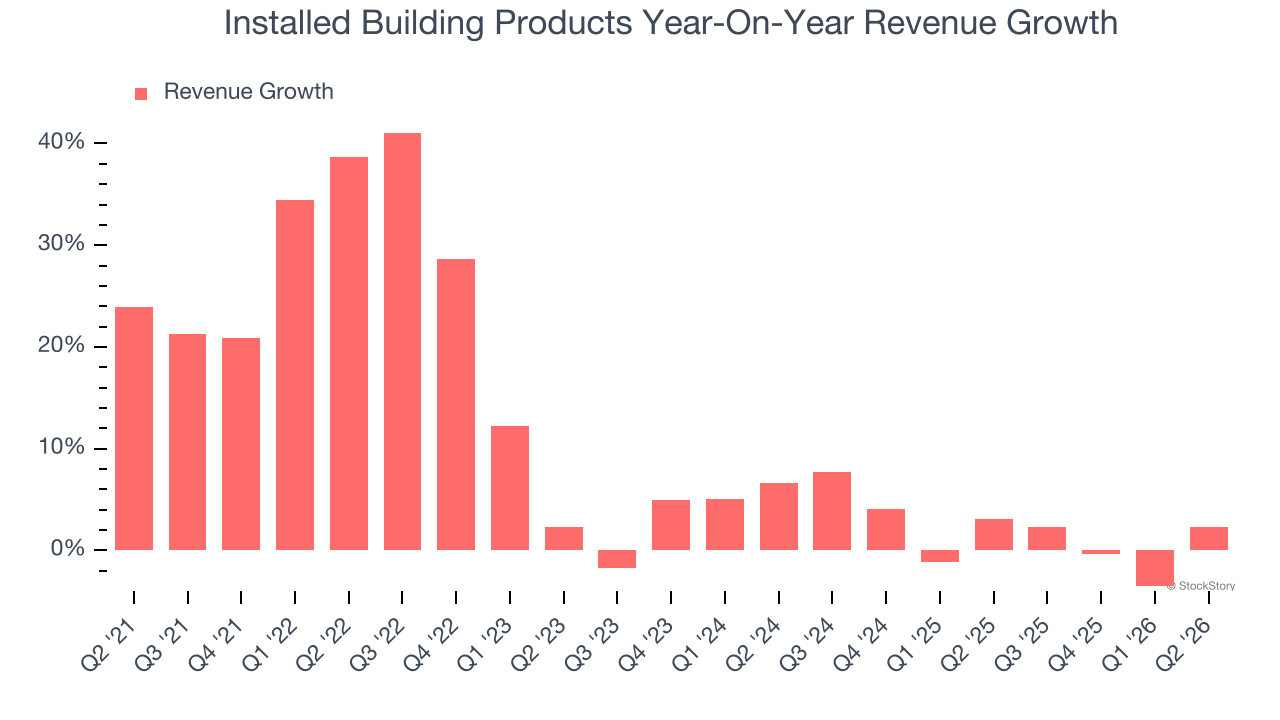
2. Projected Revenue Growth Is Slim
Forecasted revenues by Wall Street analysts signal a company’s potential. Predictions may not always be accurate, but accelerating growth typically boosts valuation multiples and stock prices while slowing growth does the opposite.
Over the next 12 months, sell-side analysts expect Installed Building Products’s revenue to rise by 3.4%. While this projection implies its newer products and services will spur better top-line performance, it is still below average for the sector.
3. Recent EPS Growth Below Our Standards
Although long-term earnings trends give us the big picture, we like to analyze EPS over a shorter period to see if we are missing a change in the business.
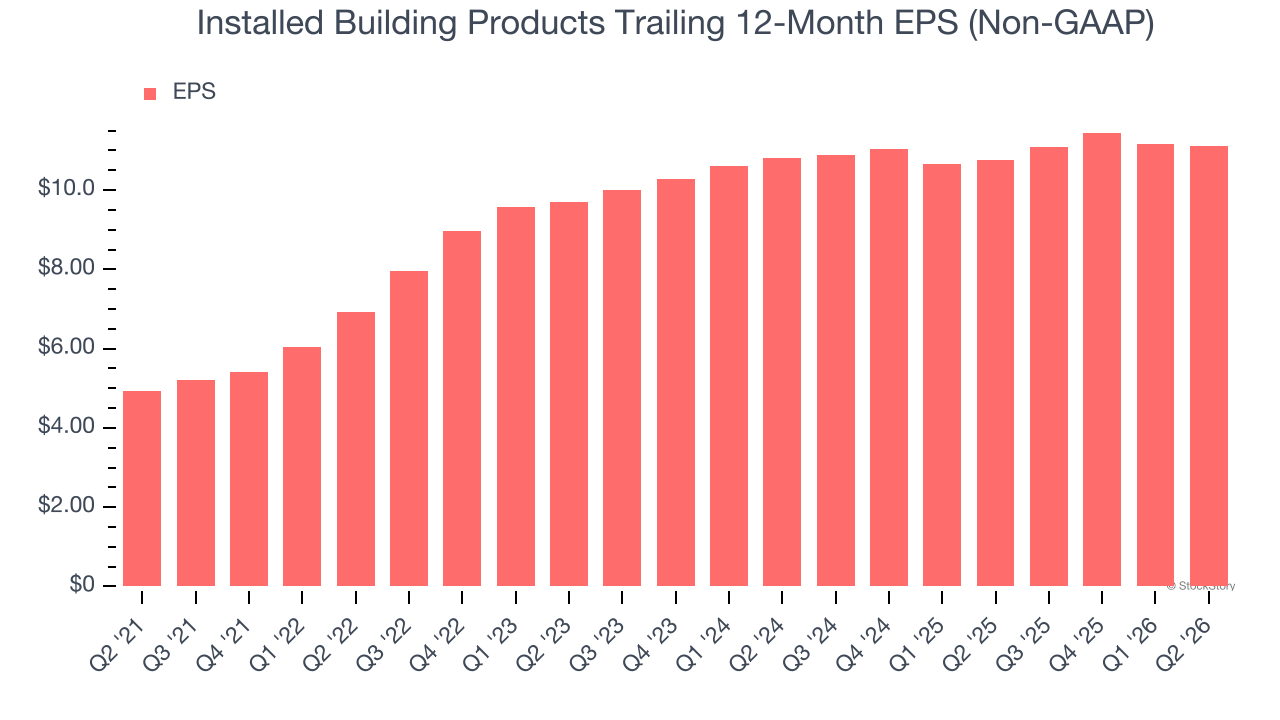
Installed Building Products’s weak 1.4% annual EPS growth over the last two years aligns with its revenue trend. This tells us it maintained its per-share profitability as it expanded.
Final Judgment
Installed Building Products isn’t a terrible business, but it isn’t one of our picks. Following the recent decline, the stock trades at 22.1× forward P/E (or $245.57 per share). This valuation multiple is fair, but we don’t have much faith in the company. We’re fairly confident there are better stocks to buy right now. Let us point you toward the Amazon and PayPal of Latin America.
High-Quality Stocks for All Market Conditions
ONE MORE THING: Top 6 Stocks for This Week. This market is separating quality stocks from expensive ones fast. AI is taking down whole sectors with no warning. In a rotation this fast, you need more than a list of good companies.
Our AI system flagged Palantir before it ran 1,662% between October 2022 and February 2026. AppLovin before it ran 753% between February 2024 and February 2026. Nvidia before it ran 1,178% between January 2023 and February 2026. Each week it produces 6 new names that pass the same tests. Get Our Top 6 Stocks for Free HERE.
Stocks that have made our list include now familiar names such as Nvidia (+1,460% between June 2020 and June 2025) as well as under-the-radar businesses like the once-small-cap company Comfort Systems (+1,154% between June 2020 and June 2025). Find your next big winner with StockStory today.