Cruise ship company Carnival (NYSE: CCL) reported Q3 2026 results topping the market’s revenue expectations, with sales up 3.5% year on year to $8.44 billion. Its non-GAAP profit of $1.43 per share was 5.9% above analysts’ consensus estimates.
Is now the time to buy Carnival? Find out by accessing our full research report, it’s free.
Carnival (CCL) Q3 2026 Highlights:
- Revenue: $8.44 billion vs analyst estimates of $8.35 billion (3.5% year-on-year growth, 1.1% beat)
- Adjusted EPS: $1.43 vs analyst estimates of $1.35 (5.9% beat)
- Adjusted EBITDA: $2.99 billion vs analyst estimates of $2.93 billion (35.5% margin, 2.1% beat)
- Management slightly raised its full-year Adjusted EPS guidance to $2.24 at the midpoint
- EBITDA guidance for the full year is $7.14 billion at the midpoint, in line with analyst expectations
- Operating Margin: 26.3%, down from 27.9% in the same quarter last year
- Free Cash Flow Margin: 8.4%, similar to the same quarter last year
- Passenger Cruise Days: up 400,000 year on year
- Market Capitalization: $30.32 billion
"Our world-class cruise lines and destinations, exceptional guest experiences delivered by the best team in travel and leisure, and enhanced demand-generation against intentionally measured capacity growth position us to continue driving higher returns. At the same time, we are putting our increasingly durable cash flow to work, reinvesting in our business while returning more capital to shareholders," said Carnival Corporation's Chief Executive Officer Josh Weinstein.
Company Overview
Boasting outrageous amenities like a planetarium on board its ships, Carnival (NYSE: CCL) is one of the world's largest leisure travel companies and a prominent player in the cruise industry.
Revenue Growth
A company’s long-term performance is an indicator of its overall quality. Any business can experience short-term success, but top-performing ones enjoy sustained growth for years. Thankfully, Carnival’s 111% annualized revenue growth over the last five years was incredible. Its growth beat the average consumer discretionary company and shows its offerings resonate with customers.
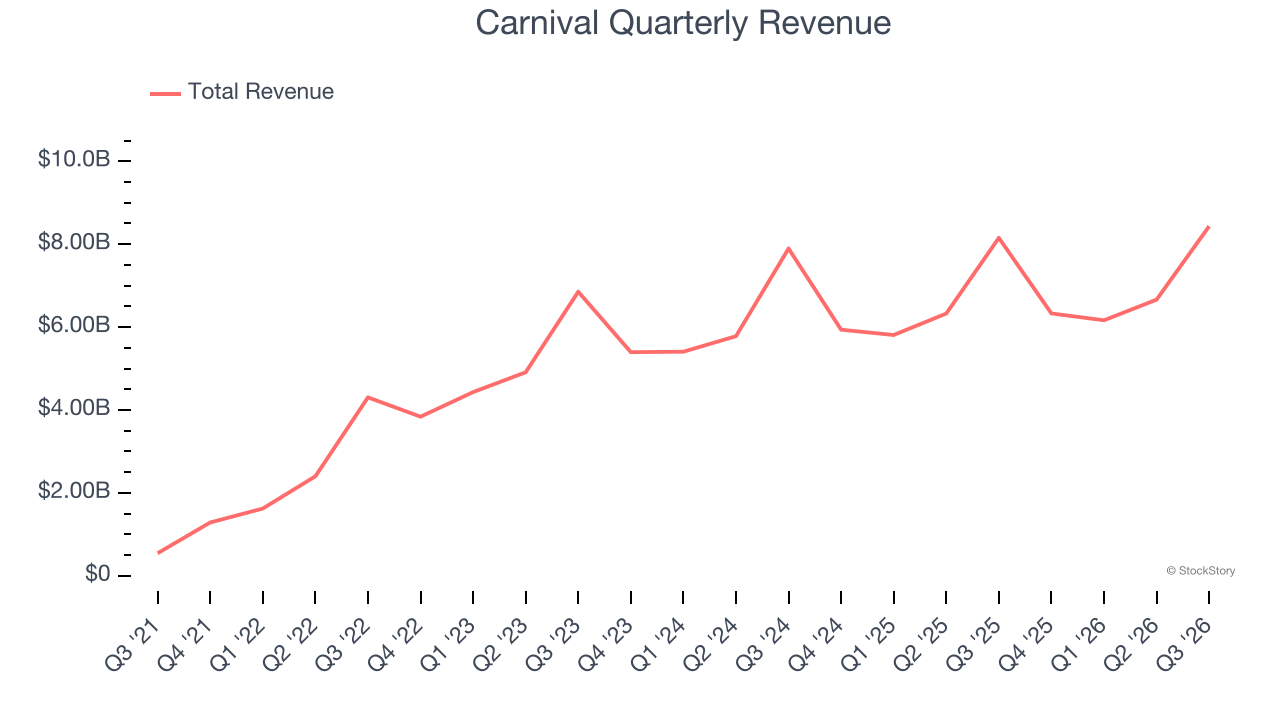
We at StockStory place the most emphasis on long-term growth, but within consumer discretionary, a stretched historical view may miss a company riding a successful new property or trend. Carnival’s recent performance shows its demand has slowed significantly as its annualized revenue growth of 6.2% over the last two years was well below its five-year trend. 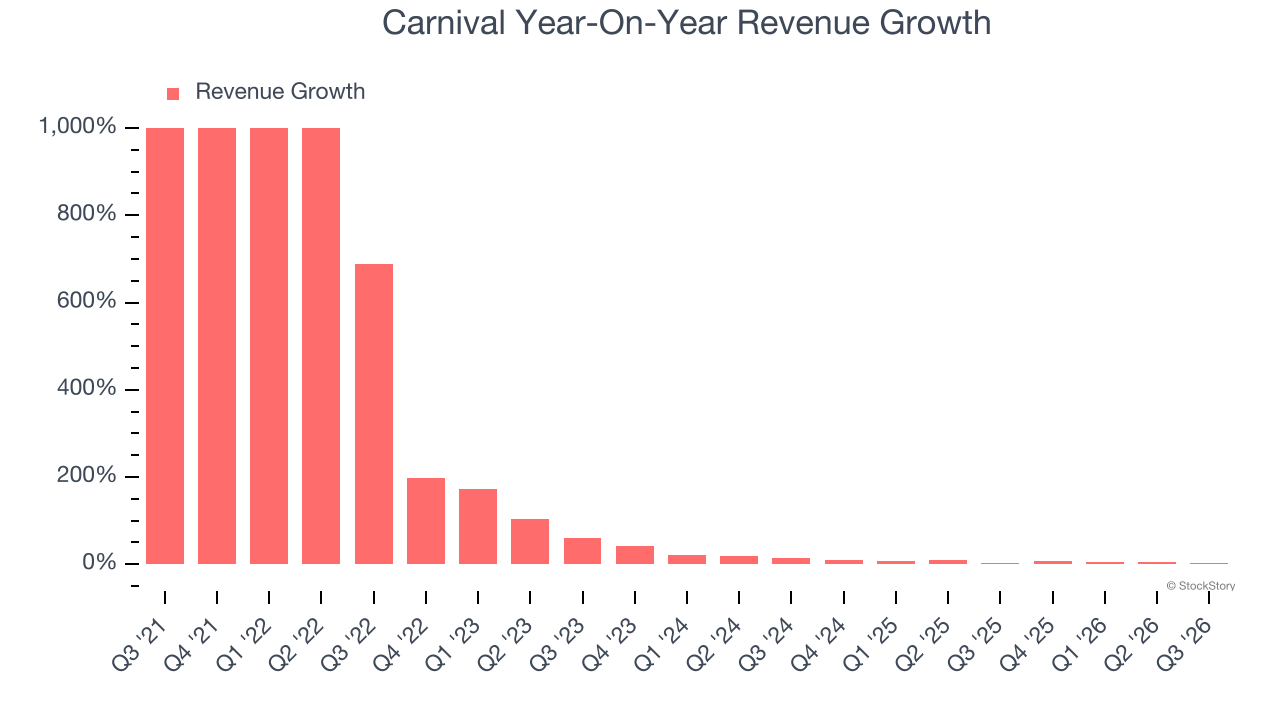
Carnival also discloses its number of passenger cruise days, which reached 27.9 million in the latest quarter. Over the last two years, Carnival’s passenger cruise days averaged 1.3% year-on-year growth. Because this number is lower than its revenue growth during the same period, we can see the company’s monetization has risen. 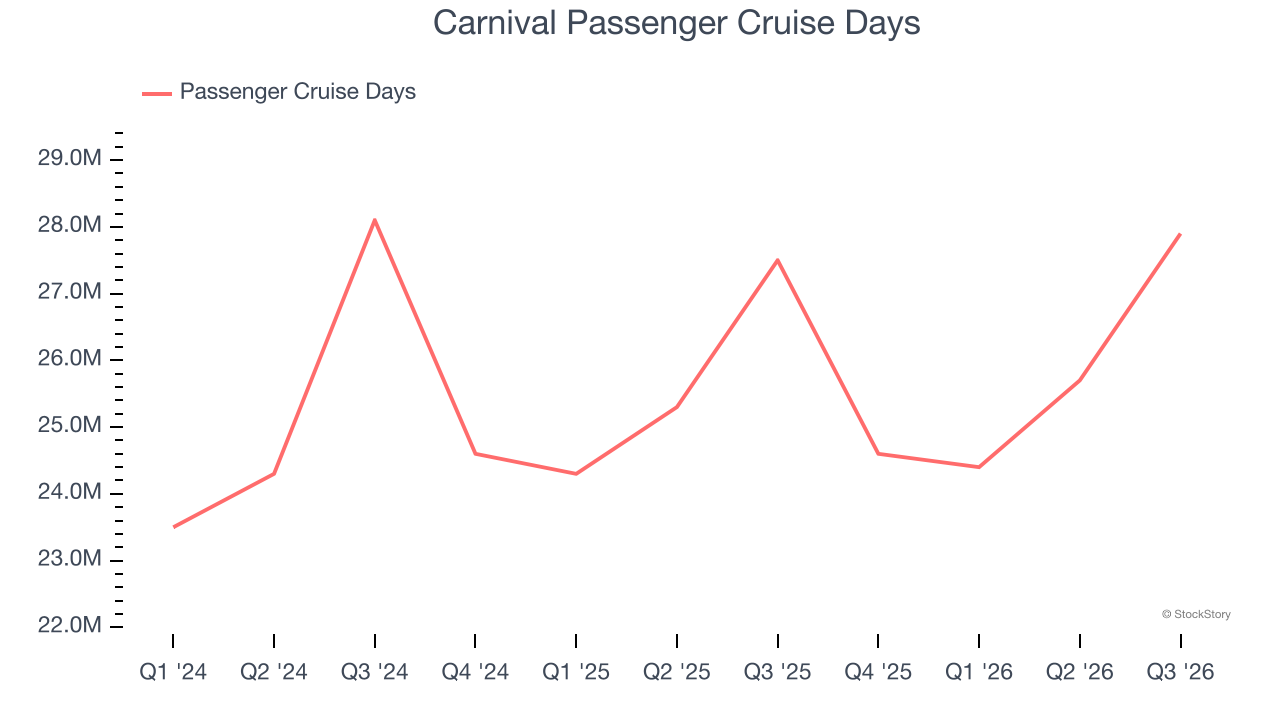
This quarter, Carnival reported modest year-on-year revenue growth of 3.5% but beat Wall Street’s estimates by 1.1%.
Looking ahead, sell-side analysts expect revenue to grow 2.3% over the next 12 months, a deceleration versus the last two years. This projection doesn’t excite us and indicates its products and services will see some demand headwinds.
ONE MORE THING: 3 Hidden Platforms Growing 3X Faster than Amazon, Google, and PayPal. Amazon, Google, and Meta all followed the same playbook: Dominate an ignored market. Build an unbeatable moat. Scale until you’re unstoppable.
These three platforms are running that exact playbook right now. The early investors in Amazon made fortunes. The early investors in these could do the same. Get All 3 Stocks Here for FREE.
Operating Margin
Operating margin is an important measure of profitability as it shows the portion of revenue left after accounting for all core expenses — everything from the cost of goods sold to advertising and wages. It’s also useful for comparing profitability across companies with different levels of debt and tax rates because it excludes interest and taxes.
Carnival’s operating margin has more or less stayed the same over the last 12 months , and we generally like to see margin increases due to economies of scale and cost efficiency over time.
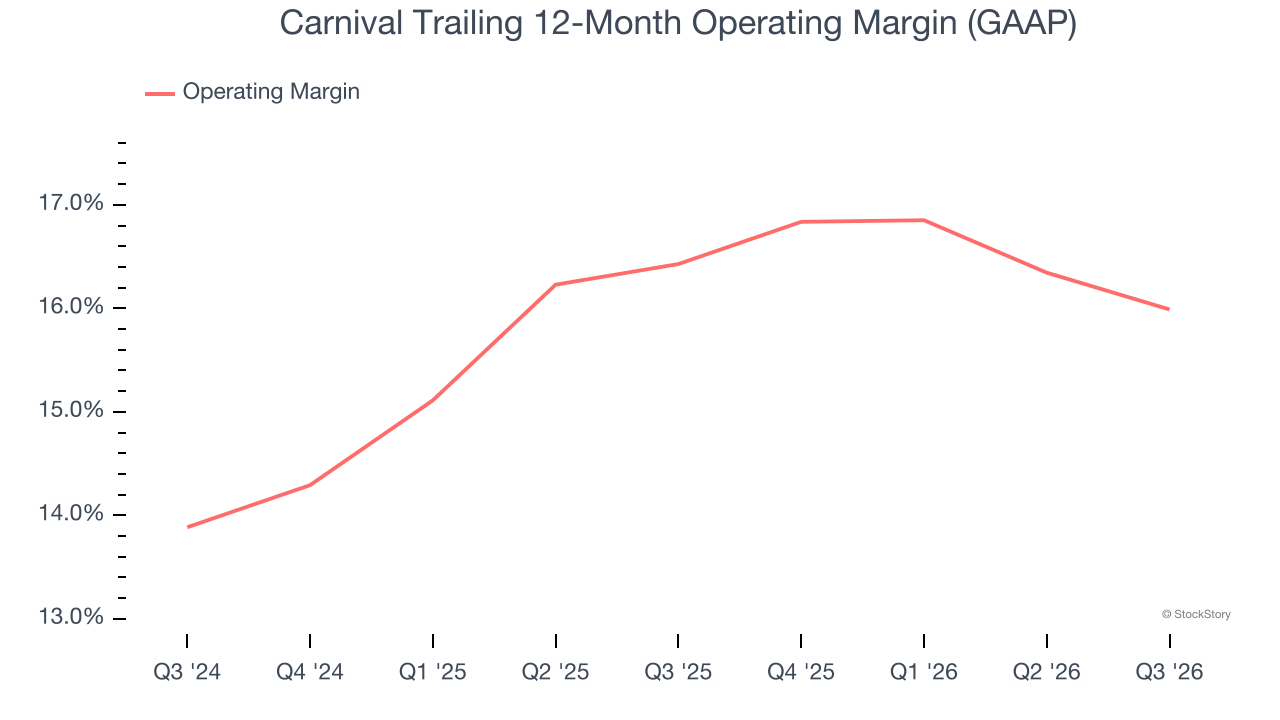
In Q3, Carnival generated an operating margin profit margin of 26.3%, down 1.5 percentage points year on year. This reduction is quite minuscule and indicates the company’s overall cost structure has been relatively stable.
Earnings Per Share
Revenue trends explain a company’s historical growth, but the long-term change in earnings per share (EPS) points to the profitability of that growth — for example, a company could inflate its sales through excessive spending on advertising and promotions.
Carnival’s full-year EPS flipped from negative to positive over the last five years. This is encouraging and shows it’s at a critical moment in its life.
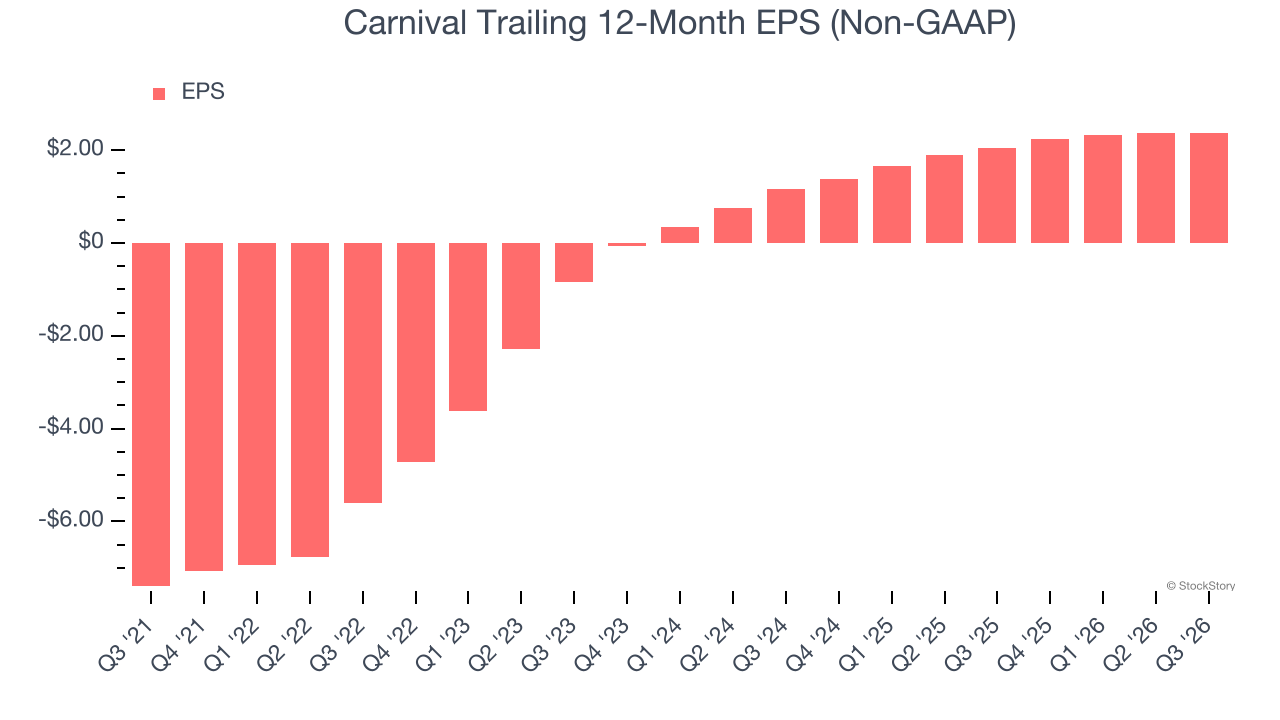
In Q3, Carnival reported adjusted EPS of $1.43, in line with the same quarter last year. This print beat analysts’ estimates by 5.9%. Over the next 12 months, Wall Street expects Carnival’s full-year EPS to stay about the same, moving from $2.38 to $2.38.
Key Takeaways from Carnival’s Q3 Results
It was good to see Carnival beat analysts’ EPS expectations this quarter. We were also happy its revenue narrowly outperformed Wall Street’s estimates. Management also slightly raised full-year EPS guidance. Zooming out, we think this was a solid quarter. The stock traded up 10.9% to $24.59 immediately after reporting.
Is Carnival an attractive investment opportunity right now? We think that the latest quarter is only one piece of the longer-term business quality puzzle. Quality, when combined with valuation, can help determine if the stock is a buy. We cover that in our actionable full research report which you can read here (it’s free).