Natural gas producer Comstock Resources (NYSE: CRK) missed Wall Street’s revenue expectations in Q1 CY2026, but sales rose 8% year on year to $419 million. Its non-GAAP profit of $0.15 per share was 34.4% below analysts’ consensus estimates.
Is now the time to buy Comstock Resources? Find out by accessing our full research report, it’s free.
Comstock Resources (CRK) Q1 CY2026 Highlights:
- Revenue: $419 million vs analyst estimates of $501.8 million (8% year-on-year growth, 16.5% miss)
- Adjusted EPS: $0.15 vs analyst expectations of $0.23 (34.4% miss)
- Adjusted EBITDA: $316.4 million vs analyst estimates of $280.3 million (75.5% margin, 12.9% beat)
- Operating Margin: 41.7%, up from 32.5% in the same quarter last year
- Free Cash Flow was -$223.3 million compared to -$123.2 million in the same quarter last year
- Oil production: up 10% year on year
- Market Capitalization: $5.22 billion
Company Overview
Operating in the Haynesville shale where a single well can produce millions of cubic feet of gas daily, Comstock Resources (NYSE: CRK) drills for and produces natural gas from underground shale rock formations in Louisiana and Texas.
Revenue Growth
A company’s long-term performance can give signals about its business quality. Even a bad business, especially in a cyclical industry, can shine for a year or so, but a top-tier one should exhibit resilience through cycles. Over the last five years, Comstock Resources grew its sales at a sluggish 6.8% compounded annual growth rate. This was below our standard for the energy upstream and integrated energy sector and is a poor baseline for our analysis.
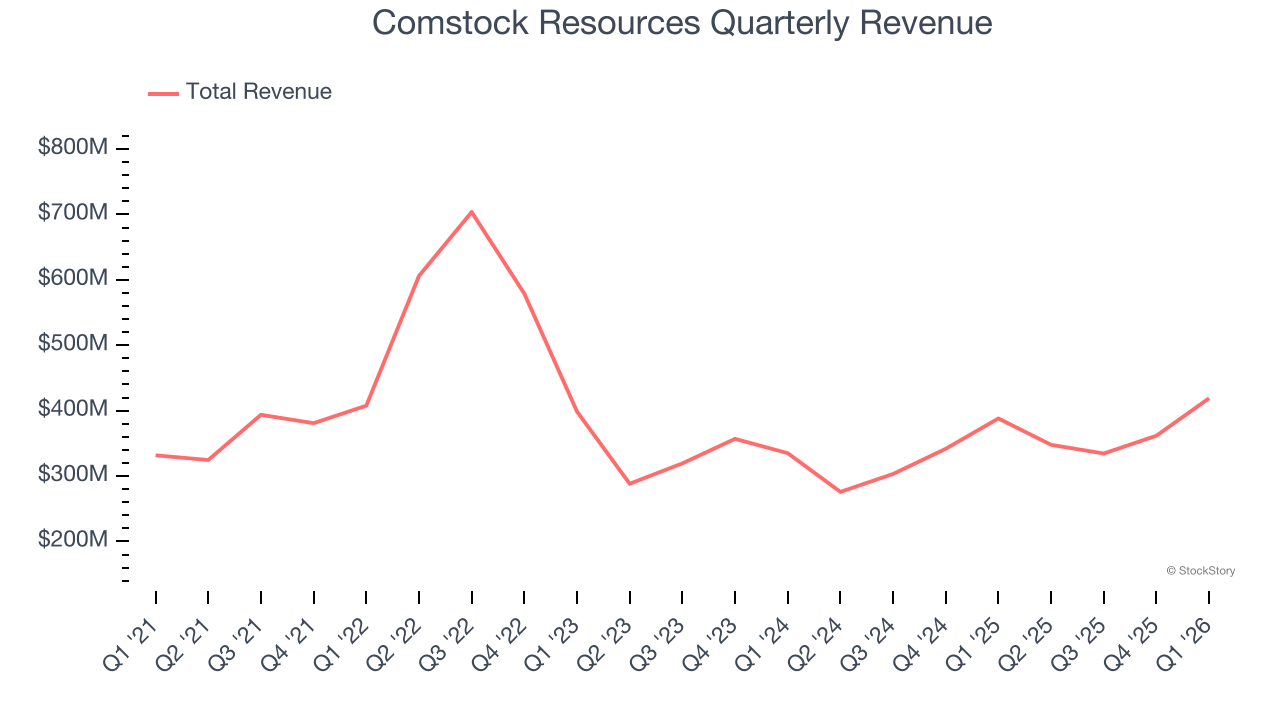
Even a long stretch in Energy can be shaped by a single commodity cycle, so extending the view to ten years adds another perspective and reveals which companies are built to grow regardless of the pricing regime. Comstock Resources’s annualized revenue growth of 20.7% over the last ten years is above its five-year trend.
While looking at revenue is important, it can also introduce noise around commodity prices and M&A. Analyzing production, on the other hand, highlights what is happening inside the asset base and whether the economic footprint of a company is expanding. Over the last two years, Comstock Resources’s oil production averaged 17.1% year-on-year declines while its natural gas production averaged 9.9% year-on-year declines. 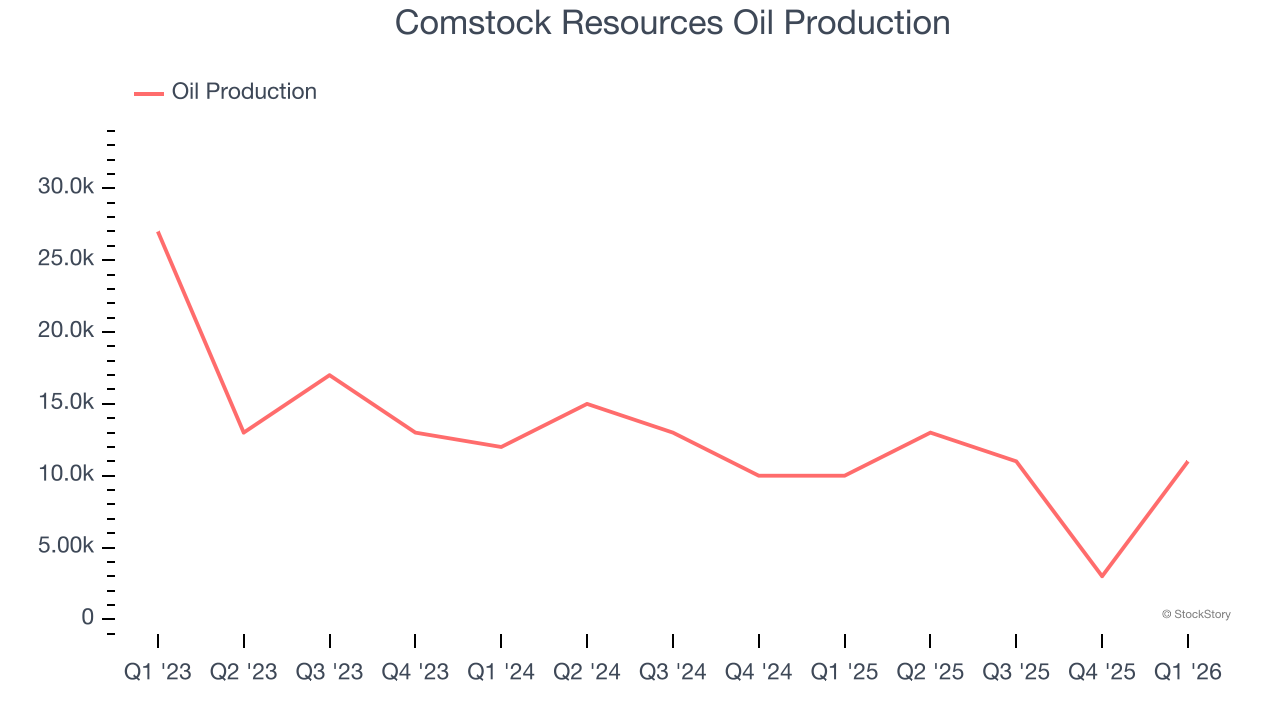
This quarter, Comstock Resources’s revenue grew by 8% year on year to $419 million, missing Wall Street’s estimates. This quarter, Comstock Resources reported year-on-year Oil production growth of 10%.
ONE MORE THING: The $21 AI Application Stock Wall Street Forgot. While Wall Street obsesses over who’s building AI, one company is already using it to print money. And nobody’s paying attention.
AI chip stocks trade at ridiculous valuations. This company processes a trillion consumer signals monthly using AI and trades at a third of the price. The gap won’t last. The institutions will figure it out. You need to see this first. Read the FREE Report Before They Notice.
Adjusted EBITDA Margin
Adjusted EBITDA margin captures the true operating profitability of an energy producer by removing accounting noise around depletion and capitalized drilling costs. It reveals how much cash the asset base generates before capital structure and reinvestment requirements shape reported earnings.
Comstock Resources has been a well-oiled machine over the last five years. It demonstrated elite profitability for an upstream and integrated energy business, boasting an average EBITDA margin of 74.8%.
Analyzing the trend in its profitability, Comstock Resources’s EBITDA margin decreased by 4.6 percentage points over the last year. This raises questions about the company’s expense base because its revenue growth should have given it leverage on its fixed costs, resulting in better economies of scale and profitability.
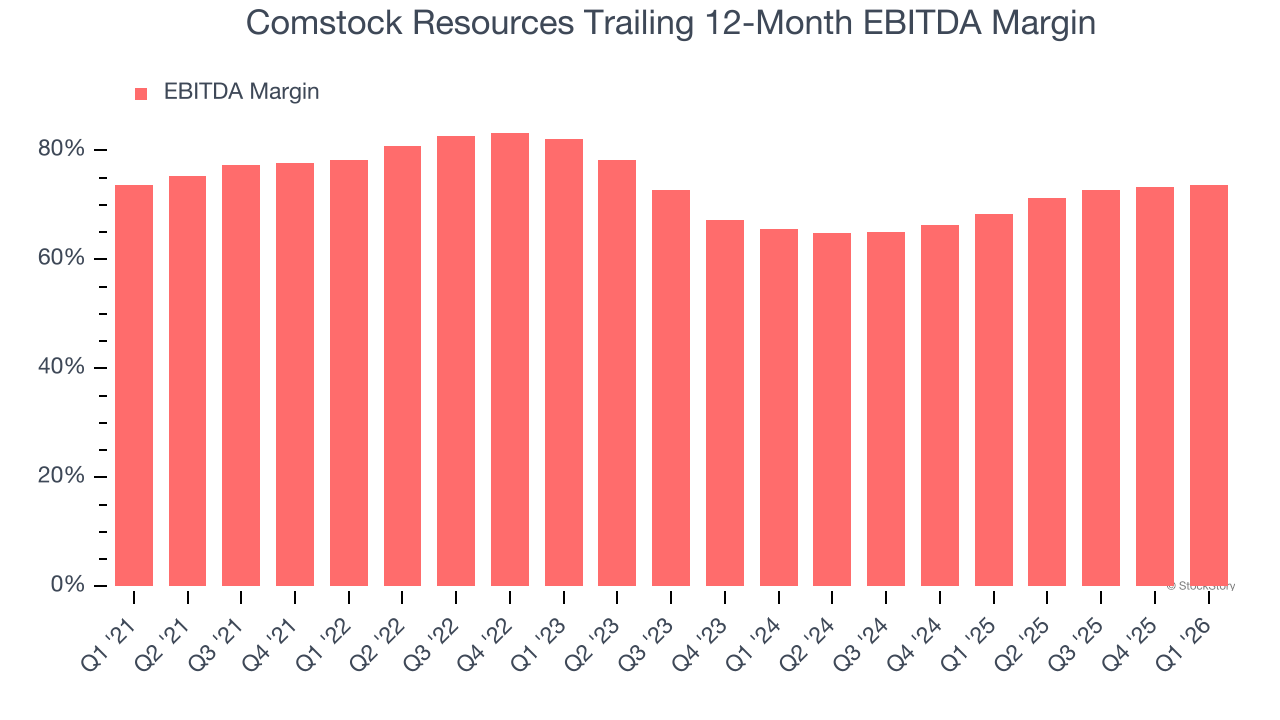
This quarter, Comstock Resources generated an EBITDA margin profit margin of 75.5%, up 1.5 percentage points year on year. This increase was a welcome development and shows it was more efficient. This adjusted EBITDA beat Wall Street’s estimates by 12.9%.
Cash Is King
Adjusted EBITDA shows how profitable a company’s existing wells are before financing and reinvestment decisions, but free cash flow shows how much value remains after paying the cost of replacing those wells. In upstream energy, production naturally declines over time, so companies must continuously reinvest just to stand still. A producer can report strong EBITDA margins yet generate little or no free cash flow if its wells decline quickly or if new drilling is expensive. Free cash flow therefore captures not only how efficiently a company produces hydrocarbons today, but also how costly it is to sustain that production into the future.
Comstock Resources’s demanding reinvestments have drained its resources over the last five years, putting it in a pinch and limiting its ability to return capital to investors. Its free cash flow margin averaged negative 10%, meaning it lit $9.99 of cash on fire for every $100 in revenue.
The level of free cash flow is important, but its durability across cycles is just as critical. Consistent margins are far more valuable than volatile swings driven by commodity prices.
Comstock Resources’s ratio of quarterly free cash flow volatility to Henry Hub gas-price volatility over the past five years was 8.3 (lower is better), indicating reasonable insulation from commodity swings.
You may be asking why we wait until the free cash flow line to perform this stability analysis versus commodity prices. Why not compare revenue or EBITDA to Henry Hub in the case of Comstock Resources? Because what ultimately matters is not how much revenue or profit you earn when prices are high but how much cash you can generate when prices are low. Free cash flow is the superior metric because it includes everything from hedging prowess to growth and maintenance capex to management behavior during good times and bad.
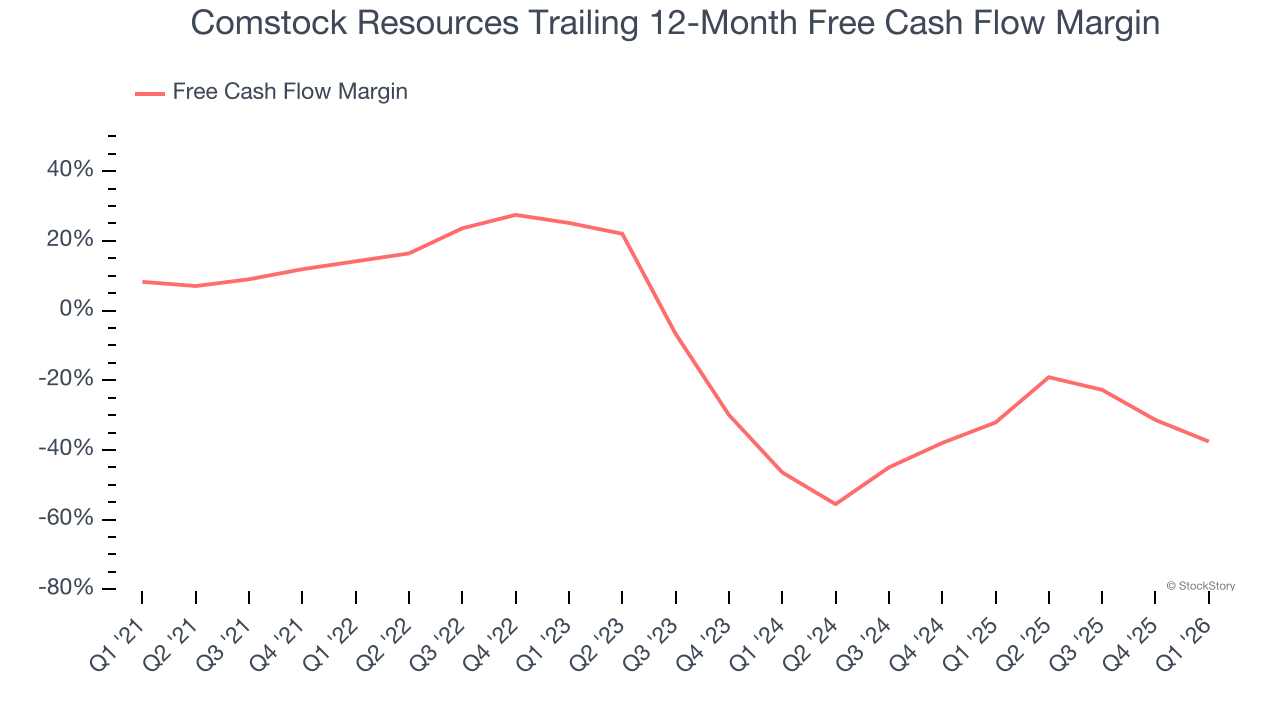
Comstock Resources burned through $223.3 million of cash in Q1, equivalent to a negative 53.3% margin. The company’s cash burn increased from $123.2 million of lost cash in the same quarter last year.
Key Takeaways from Comstock Resources’s Q1 Results
We enjoyed seeing Comstock Resources beat analysts’ EBITDA expectations this quarter. On the other hand, its revenue missed and its EPS fell short of Wall Street’s estimates. Overall, this was a softer quarter. The stock remained flat at $17.19 immediately following the results.
Comstock Resources’s earnings report left more to be desired. Let’s look forward to see if this quarter has created an opportunity to buy the stock. The latest quarter does matter, but not nearly as much as longer-term fundamentals and valuation, when deciding if the stock is a buy. We cover that in our actionable full research report which you can read here (it’s free).